Health & Medical
A1C Chart: Levels, Ranges, eAG and Treatment Goals
A1C, also called HbA1c or glycated hemoglobin, is a blood test that estimates average blood glucose over the previous two to three months by measuring the percentage of hemoglobin with glucose attached.
This A1C chart provides general education, not diagnosis or individualized medical advice. A healthcare professional should interpret laboratory results, symptoms, treatment goals, pregnancy needs, and conditions that affect A1C accuracy. Read the Disclaimer.
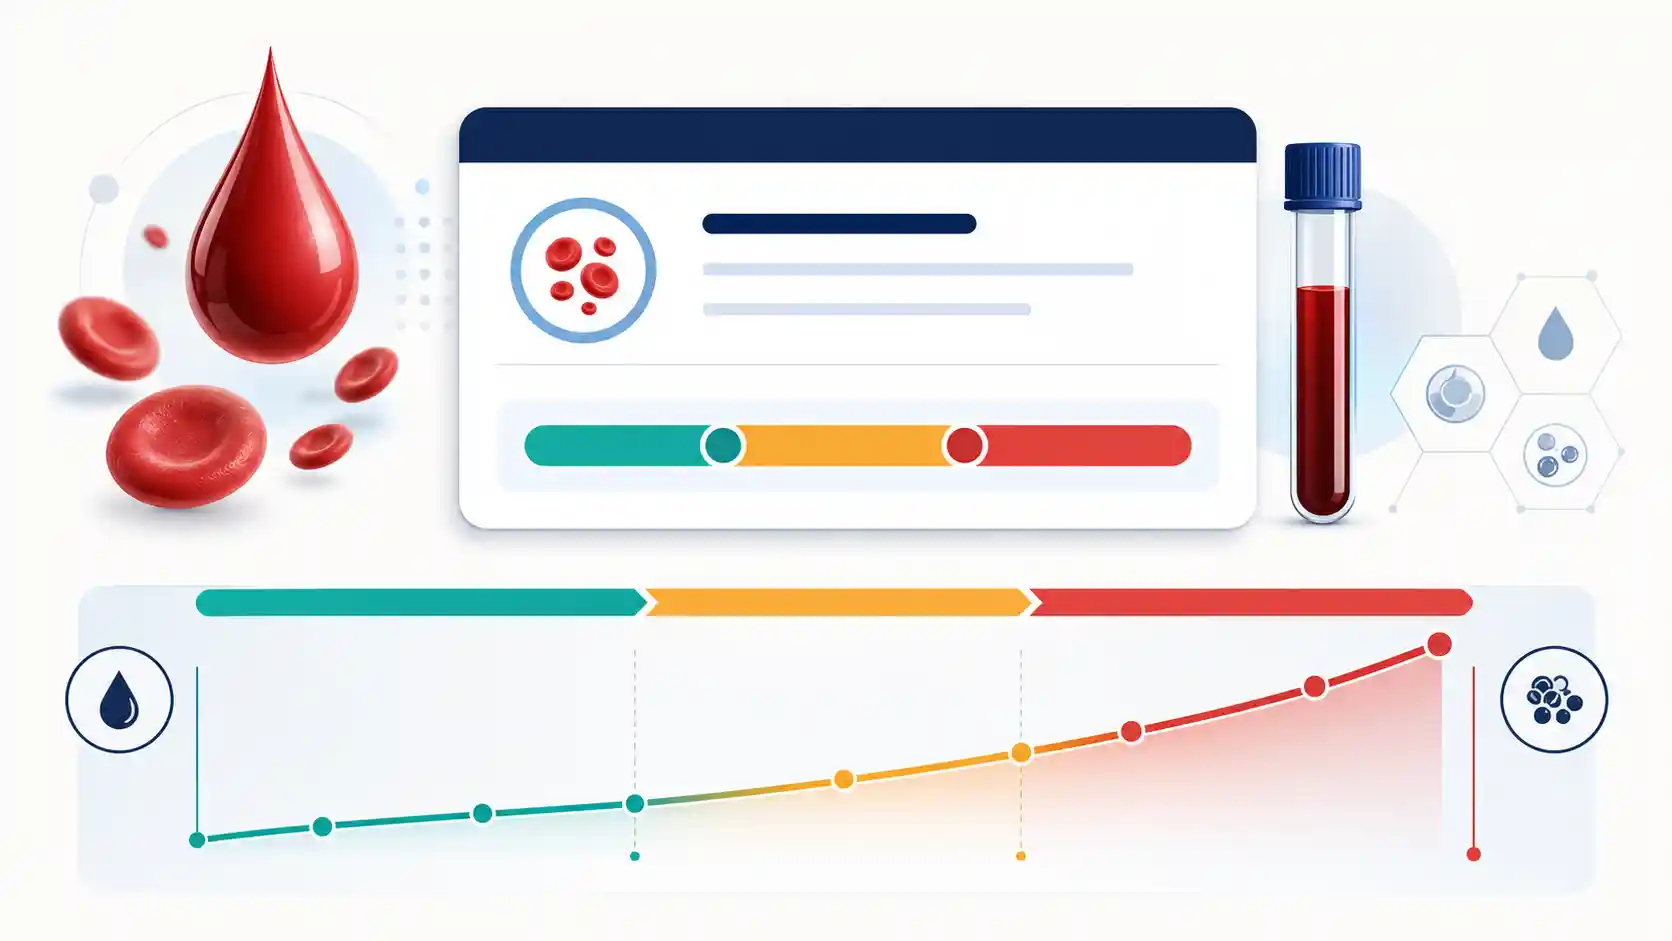
A1C levels at a glance
Use these values to identify the relevant diagnostic category, then read the tables below for IFCC units, estimated average glucose, management goals, test timing, and factors that can change the result.
- Normal diagnostic range
- Below 5.7%
- Prediabetes range
- 5.7%–6.4%
- Diabetes threshold
- 6.5% or higher
- Common adult treatment goal
- 7% or less
Below 39 mmol/mol in IFCC units.
About 39–46 mmol/mol.
48 mmol/mol or higher; confirmation is usually required without clear symptoms.
A starting reference for many adults with diabetes, not a universal target.
A1C diagnostic ranges for nonpregnant adults
Common laboratory A1C thresholds used to identify normal glucose regulation, prediabetes, and diabetes in nonpregnant adults.
Swipe horizontally inside the table to view every column.
| A1C result (NGSP) | IFCC equivalent | Diagnostic category | Approximate eAG | How clinicians use the result |
|---|---|---|---|---|
| Below 5.7% | Below 39 mmol/mol | Normal range | Below about 117 mg/dL (6.5 mmol/L) | Below the laboratory threshold for prediabetes; risk still depends on the full clinical picture. |
| 5.7% to 6.4% — Prediabetes range | 39 to 46 mmol/mol | Prediabetes range | About 117 to 137 mg/dL (6.5 to 7.6 mmol/L) | Signals increased risk of developing type 2 diabetes; the higher the value, the greater the risk within this range. |
| 6.5% or higher — Diabetes range | 48 mmol/mol or higher | Diabetes range | About 140 mg/dL (7.8 mmol/L) or higher | Meets the A1C laboratory criterion for diabetes; a second measurement usually confirms diagnosis when clear symptoms are absent. |
NGSP reports A1C as a percentage. IFCC reports HbA1c as mmol/mol. eAG uses the ADAG population equation and is an estimate.
- • A1C diagnosis requires a laboratory method standardized to the NGSP/DCCT reference. Many point-of-care tests should not be used to diagnose diabetes.
- • A1C does not diagnose gestational diabetes, and clinicians do not rely on it alone when type 1 diabetes may be progressing rapidly.
- • Screening thresholds are not personal treatment targets for someone already living with diabetes.
Download or export
What A1C means and what the test measures
A1C stands for hemoglobin A1C. Laboratories may also call it HbA1c, glycated hemoglobin, glycohemoglobin, or glycosylated hemoglobin. Hemoglobin carries oxygen inside red blood cells. Glucose circulating in the blood attaches to hemoglobin through a process called glycation.
The laboratory reports the share of hemoglobin with glucose attached as a percentage. Higher average glucose usually produces a higher A1C value. Because red blood cells circulate for months, the result summarizes glucose exposure over roughly the previous two to three months rather than a single day.
A1C acts as a weighted average. Glucose levels from the most recent month influence the result more than levels from earlier months. A large recent change can therefore move A1C before an entire red-blood-cell lifespan has passed.
- No fasting is normally required for an A1C blood draw.
- The test supports screening, diagnosis of type 2 diabetes and prediabetes, and long-term diabetes management.
- A1C does not reveal every high, low, or rapid glucose swing.
Visual reference
A1C diagnostic range scale
A labelled visual scale separates the normal, prediabetes, and diabetes laboratory ranges for nonpregnant adults. Labels and borders provide meaning without relying on color alone.
Below 5.7%
Normal range
5.7%–6.4%
Prediabetes range
6.5% or higher
Diabetes range
| A1C range | Category |
|---|---|
| Below 5.7% | Normal range |
| 5.7%–6.4% | Prediabetes range |
| 6.5% or higher | Diabetes range |
Source: NIDDK, Diabetes Tests & Diagnosis. This is a screening reference, not an individualized treatment target.
How to read an A1C result correctly
Start by identifying the purpose of the test. Diagnostic thresholds answer whether a laboratory value falls in the normal, prediabetes, or diabetes range. Treatment goals answer a different question: whether a person already receiving diabetes care is meeting an individualized plan.
Next, check the unit. United States reports usually show NGSP percentage units, while many other countries use IFCC mmol/mol. A value of 6.5% is approximately 48 mmol/mol. Estimated average glucose, or eAG, translates the same A1C value into mg/dL or mmol/L.
Finally, compare A1C with symptoms, medical history, medications, pregnancy status, anemia or blood disorders, and meter or CGM patterns. A number that conflicts with the rest of the evidence deserves clinical review rather than an automatic conclusion.
A1C goals by age, pregnancy, and health status
Current A1C management reference points for adults, children, pregnancy, and older-adult health states, showing why one target does not fit everyone.
Swipe horizontally inside the table to view every column.
| Clinical situation | Common A1C reference point | Attributes that shape the goal | Important context |
|---|---|---|---|
| Many nonpregnant adults with diabetes | 7% or less | Overall health, diabetes duration, medication burden, hypoglycemia risk, and personal priorities | A common starting goal that a care team may tighten or relax. |
| Selected people with low treatment risk and burden | Below 6.5% may be appropriate | Good health and function, low hypoglycemia risk, and a treatment plan that can reach the goal safely | A lower goal should not create unsafe lows or excessive burden. |
| Most children and adolescents with diabetes | Below 7.0% | Diabetes type, hypoglycemia awareness, CGM or automated insulin delivery access, family capacity, and treatment burden | Current ADA guidance requires individualized goals; selected youth may use lower goals safely, while higher-risk situations may need less stringent goals. |
| Before pregnancy with preexisting diabetes | Ideally below 6.5% | Pregnancy planning, medication safety, hypoglycemia risk, glucose monitoring, and access to preconception care | The goal applies before conception and should be reached as safely as possible with pregnancy-appropriate therapy. |
| During pregnancy with preexisting diabetes | Ideally below 6.0%; may relax below 7.0% | Trimester, hypoglycemia risk, fasting and post-meal glucose, CGM data, red-blood-cell turnover, and maternal-fetal health | A1C acts as a secondary measure during pregnancy; glucose targets and monitoring carry greater day-to-day importance. |
| Healthy older adults | Below 7.0% to 7.5% | Few stable chronic illnesses with intact cognitive and functional status | Current ADA guidance keeps the target individualized even within this range. |
| Older adults with intermediate or complex health | Below 8.0% | Multiple chronic illnesses, frailty, cognitive or functional limitations, and treatment risk | Avoiding hypoglycemia and treatment harm becomes a stronger priority. |
| Very complex health or limited life expectancy | Do not rely on A1C alone | Symptoms, current glucose patterns, comfort, safety, and treatment burden | Care often focuses on preventing hypoglycemia and symptomatic hyperglycemia rather than a fixed A1C number. |
A1C goals are percentages; IFCC equivalents may also appear on laboratory reports.
- • These are population-level reference points, not a recommendation for an individual reader.
- • Pregnancy, childhood, advanced kidney disease, recurrent hypoglycemia, and other situations require separate clinical guidance.
Download or export
Diagnostic A1C ranges are not personal treatment goals
The 6.5% diabetes threshold helps diagnose diabetes; it does not mean every person with diabetes should aim for 6.4% or lower. For many adults, 7% or less serves as a common management reference, but current guidance emphasizes individualization.
A care team may consider a lower target when it can be reached safely with little treatment burden. It may choose a less stringent target when hypoglycemia, frailty, cognitive impairment, advanced illness, medication burden, or limited life expectancy makes intensive treatment more harmful.
Conversion chart
A1C to estimated average glucose line chart
The line shows how estimated average glucose rises as A1C increases from 4% to 14% using the published ADAG equation. Each labelled point is also available in the conversion table below.
6.0% A1C
≈ 126 mg/dL
≈ 7.0 mmol/L
7.0% A1C
≈ 154 mg/dL
≈ 8.6 mmol/L
10.0% A1C
≈ 240 mg/dL
≈ 13.3 mmol/L
A1C to eAG and IFCC conversion chart
A1C percentages from 4.0% through 14.0% converted to IFCC HbA1c units and estimated average glucose in both common glucose units.
Swipe horizontally inside the table to view every column.
| A1C (NGSP) | HbA1c (IFCC) | Estimated average glucose | eAG in SI units |
|---|---|---|---|
| 4.0% | 20 mmol/mol | 68 mg/dL | 3.8 mmol/L |
| 4.5% | 26 mmol/mol | 82 mg/dL | 4.6 mmol/L |
| 5.0% | 31 mmol/mol | 97 mg/dL | 5.4 mmol/L |
| 5.5% — Near the upper normal range | 37 mmol/mol | 111 mg/dL | 6.2 mmol/L |
| 6.0% | 42 mmol/mol | 126 mg/dL | 7.0 mmol/L |
| 6.5% — Diabetes diagnostic threshold | 48 mmol/mol | 140 mg/dL | 7.8 mmol/L |
| 7.0% — Common treatment reference point | 53 mmol/mol | 154 mg/dL | 8.6 mmol/L |
| 7.5% | 58 mmol/mol | 169 mg/dL | 9.4 mmol/L |
| 8.0% | 64 mmol/mol | 183 mg/dL | 10.2 mmol/L |
| 8.5% | 69 mmol/mol | 197 mg/dL | 10.9 mmol/L |
| 9.0% | 75 mmol/mol | 212 mg/dL | 11.8 mmol/L |
| 9.5% | 80 mmol/mol | 226 mg/dL | 12.6 mmol/L |
| 10.0% | 86 mmol/mol | 240 mg/dL | 13.3 mmol/L |
| 10.5% | 91 mmol/mol | 255 mg/dL | 14.2 mmol/L |
| 11.0% | 97 mmol/mol | 269 mg/dL | 14.9 mmol/L |
| 11.5% | 102 mmol/mol | 283 mg/dL | 15.7 mmol/L |
| 12.0% | 108 mmol/mol | 298 mg/dL | 16.6 mmol/L |
| 12.5% | 113 mmol/mol | 312 mg/dL | 17.3 mmol/L |
| 13.0% | 119 mmol/mol | 326 mg/dL | 18.1 mmol/L |
| 13.5% | 124 mmol/mol | 341 mg/dL | 18.9 mmol/L |
| 14.0% | 130 mmol/mol | 355 mg/dL | 19.7 mmol/L |
eAG (mg/dL) = 28.7 × A1C − 46.7. Convert mg/dL to mmol/L by dividing by 18. IFCC values use the NGSP–IFCC master equation.
- • Rounded values may differ slightly from a laboratory report or calculator because of rounding rules.
- • eAG describes a statistical relationship. It cannot display glucose variability, time in range, hypoglycemia, or post-meal peaks.
Download or export
Interactive tool
A1C and estimated average glucose converter
Convert A1C to estimated average glucose, or convert eAG in mg/dL back to an estimated A1C. The calculation stays in your browser and is not sent to an external service.
Formula source: American Diabetes Association. eAG (mg/dL) = 28.7 × A1C − 46.7.
This output is an estimate, not a diagnosis or personal treatment target. Differences between A1C and glucose readings can occur for several medical and measurement reasons.
A1C and estimated average glucose conversion
Estimated average glucose converts A1C into the units used by glucose meters. The ADAG equation is eAG in mg/dL = 28.7 multiplied by A1C, minus 46.7. An A1C of 7.0% therefore corresponds to an estimated average glucose of about 154 mg/dL, or 8.6 mmol/L.
The word estimated matters. Two people with the same A1C can have different glucose patterns. One person may remain near the average most of the time, while another alternates between high and low values. Both patterns can produce a similar average but require different clinical interpretation.
Why A1C may not match a meter or CGM average
A blood glucose meter records only the moments when a person checks. If checks cluster around mornings or meals, the calculated meter average may omit overnight values, post-meal peaks, exercise periods, and other unmeasured hours. A CGM captures more of the day but measures interstitial glucose and covers only the sensor-wear period.
A1C also depends on red-blood-cell biology. Differences in cell lifespan, hemoglobin variants, anemia, kidney disease, transfusion, pregnancy, and laboratory method can shift the relationship between measured A1C and actual average glucose.
A1C versus blood glucose meter and CGM data
A comparison of the time period, values, strengths, and limitations of A1C, a blood glucose meter, and a continuous glucose monitor.
Swipe horizontally inside the table to view every column.
| Measure | What it reports | Time represented | Best at showing | What it can miss |
|---|---|---|---|---|
| A1C laboratory test | Percentage of glycated hemoglobin | Weighted average over about 2 to 3 months | Long-term glucose exposure and broad treatment response | Daily variability, exact highs and lows, and time in range |
| Blood glucose meter (BGM) | Glucose in mg/dL or mmol/L | One moment per check | Immediate values for a specific time, meal, symptom, or treatment decision | Unmeasured hours between checks and the complete long-term pattern |
| Continuous glucose monitor (CGM) | Frequent interstitial-glucose estimates and trend data | Day-to-day patterns across the sensor-wear period | Time in range, variability, trends, and recurring high or low periods | It measures interstitial rather than laboratory blood glucose and may require clinical interpretation |
- • A1C and daily glucose data answer different questions. Many diabetes care plans use them together rather than treating one as a replacement for the other.
Download or export
How to lower A1C safely when it is above your goal
Lowering A1C starts with identifying the glucose pattern and the reason the value is above the personal goal. A care plan may address medicines, food and drink, physical activity, sleep, stress, illness, device technique, treatment access, or several of these attributes together.
Avoid using a generic promise such as “lower A1C by one point in three months.” The response depends on the starting A1C, diabetes type, medicine class and dose, glucose pattern, consistency, physiology, and whether a change can be made without hypoglycemia or another adverse effect.
Review current meter or CGM data with the care team when available. Those values can reveal whether fasting glucose, after-meal peaks, overnight patterns, missed treatment, illness, or repeated lows are shaping the average. They also provide feedback sooner than the next A1C result.
- Take prescribed medicines as directed and discuss side effects, missed doses, cost, or access barriers instead of changing treatment alone.
- Use an individualized eating plan that accounts for carbohydrate amount and quality, portions, meal timing, culture, preferences, and other health conditions.
- Build physical activity gradually and plan for glucose monitoring or carbohydrate adjustments when medicines can cause hypoglycemia.
- Ask whether diabetes self-management education, a registered dietitian nutritionist, CGM review, or medication review would add useful support.
Ways to lower A1C safely with a diabetes care plan
Practical action areas a person can review with a healthcare professional when A1C is above an individualized goal, without promising a fixed reduction.
Swipe horizontally inside the table to view every column.
| Action area | Attributes and values to review | How the area can affect glucose | Safety and interpretation note |
|---|---|---|---|
| Medication plan | Medicine name, dose, timing, missed doses, side effects, affordability, and recent changes | Diabetes medicines can lower fasting glucose, after-meal glucose, or both when the treatment matches the person’s needs. | Do not start, stop, or change a prescription without the care team; insulin and some medicines can cause hypoglycemia. |
| Food and drink pattern | Carbohydrate amount and type, portions, meal timing, fiber, sugary drinks, alcohol, culture, access, and preferences | Meals and drinks shape post-meal peaks and total daily glucose exposure. | No single eating pattern fits everyone; pregnancy, kidney disease, medicines, food access, and eating-disorder risk change the plan. |
| Physical activity | Activity type, frequency, duration, intensity, timing, current fitness, and glucose response | Movement can improve insulin sensitivity and help muscles use glucose during and after activity. | Exercise can also lower glucose too far when combined with insulin or some medicines, so monitoring and an individualized safety plan matter. |
| Meter or CGM pattern review | Fasting values, after-meal values, overnight patterns, time in range, variability, highs, lows, and data gaps | Pattern data can identify which times of day contribute most to the longer-term A1C average. | Averages can hide repeated highs and lows; urgent or severe values require the action plan provided by a healthcare professional. |
| Sleep, stress, illness, and medicines for other conditions | Sleep duration, shift work, stress load, infection, pain, menstrual or hormonal changes, and medicines such as glucocorticoids | Hormones, acute illness, disrupted sleep, and certain medicines can raise glucose or make it less predictable. | Use a clinician-approved sick-day plan and seek prompt care for severe symptoms, ketones, dehydration, or persistent extreme glucose values. |
| Diabetes education and follow-up | Device technique, injection or pump sites, medication understanding, goal setting, problem-solving skills, and follow-up access | Education can make daily treatment steps more consistent and help the care plan respond to real glucose patterns. | Barriers such as cost, language, dexterity, vision, cognition, work, or caregiving responsibilities belong in the treatment discussion. |
- • The expected A1C change depends on the starting value, diabetes type, treatment, adherence, physiology, duration, and safety limits; a fixed promise would be misleading.
- • A1C usually changes over weeks to months. Current glucose data may show a response before the next A1C test.
Download or export
How often A1C is commonly checked
Typical monitoring intervals for adults, with timing adjusted by diagnosis, treatment changes, glucose goals, and clinician judgment.
Swipe horizontally inside the table to view every column.
| Situation | Common interval | Why the interval may fit | When timing may change |
|---|---|---|---|
| Diabetes treatment is stable and goals are being met | At least twice a year | Confirms that average glucose remains aligned with the treatment plan. | A clinician may test more often when health status, medicines, or glucose patterns change. |
| Treatment changed or A1C is above the personal goal | About every 3 months | A three-month interval captures a substantial part of a new red-blood-cell cycle. | The clinical situation can require earlier glucose review even though A1C changes more slowly. |
| Prediabetes or a result close to a diagnostic threshold | Individualized follow-up | Risk factors and the distance from the threshold affect the retesting plan. | Some high-risk cases are reassessed within months; routine follow-up may be longer. |
| Normal screening result without diabetes | Based on age and risk factors | A normal value does not remove future risk when risk factors remain. | Pregnancy, symptoms, weight change, medicines, or new risk factors can prompt earlier testing. |
- • A1C monitoring does not replace finger-stick testing or continuous glucose monitoring when those are part of a treatment plan.
Download or export
When A1C can be less reliable
A1C becomes harder to interpret when a condition changes how quickly red blood cells are produced, removed, or replaced. Recent blood loss, transfusion, hemodialysis, erythropoietin treatment, and some anemias can all change the age distribution of circulating red cells.
Hemoglobin variants may interfere with some assay methods or change red-blood-cell lifespan. The NGSP publishes method-specific interference information. When the A1C result does not fit glucose readings, the laboratory method and the person’s blood history become relevant attributes.
A clinician may repeat the test, order fasting plasma glucose or an oral glucose tolerance test, review CGM or meter data, or use another glycemic marker when A1C is unreliable. The appropriate alternative depends on the clinical situation.
Conditions and factors that can affect A1C accuracy
Situations that can change red-blood-cell lifespan, alter hemoglobin, interfere with an assay, or weaken the relationship between A1C and average glucose.
Swipe horizontally inside the table to view every column.
| Condition or factor | Possible effect on A1C | Why interpretation changes | Useful follow-up question |
|---|---|---|---|
| Iron-deficiency anemia | May read falsely high | Very low iron can change red-blood-cell characteristics and the measured A1C relationship. | Has iron deficiency been evaluated or treated? |
| Recent major blood loss | May not reflect usual average glucose | A younger red-blood-cell population has had less time for glucose exposure. | Should A1C be delayed or paired with another glucose measure? |
| Recent blood transfusion | May be falsely high or low | Donor cells have a different age and glucose-exposure history. | When did the transfusion occur, and what alternative test is appropriate? |
| Hemoglobin variants or sickle cell conditions | May be falsely high or low depending on the assay and condition | Some variants interfere with specific laboratory methods; shortened cell lifespan can also change the result. | Which A1C method did the laboratory use? |
| Erythropoietin treatment or hemodialysis | Can lower reliability | Treatment and kidney failure can alter red-blood-cell production and lifespan. | Would glucose monitoring, glycated albumin, or another marker add context? |
| Kidney failure | May be falsely high or low | Anemia, treatment, and metabolic changes can disrupt the usual A1C–glucose relationship. | Does the A1C agree with meter or CGM patterns? |
| Liver disease | May be unreliable | Liver disease can affect red-blood-cell turnover and other factors that influence the assay. | Should the care team use another measure of glycemia? |
| Pregnancy | Interpretation changes across pregnancy | Red-blood-cell turnover and pregnancy-specific glucose goals differ from nonpregnant adults. | Which pregnancy-specific tests and targets apply? |
| A1C and meter or CGM values do not match | Possible assay or biologic discordance | Average glucose, testing patterns, variants, and red-cell factors may explain the mismatch. | Should the test be repeated or checked with another laboratory method? |
- • The direction and size of bias depend on the condition and the laboratory method; do not assume every factor always moves A1C in one direction.
Download or export
Questions to discuss after an A1C result
Ask whether the result was used for screening, diagnosis, or treatment monitoring; whether it requires confirmation; what personal goal fits your health situation; and whether any condition or medicine could affect accuracy.
Also ask how the A1C compares with home glucose or CGM data, what changes deserve attention, when the next test should occur, and which symptoms require urgent care. These questions turn an isolated value into a safer, more useful clinical discussion.
A1C chart frequently asked questions
What is a normal A1C level for a person without diabetes?
For diagnostic testing in a nonpregnant adult, an A1C below 5.7% is in the normal range. Risk can still vary within and below that range based on age, family history, weight, medicines, pregnancy, and other factors.
What does an A1C of 5.7% mean?
An A1C of 5.7% sits at the lower boundary of the prediabetes diagnostic range. A clinician considers confirmation, other glucose tests, and risk factors before deciding what follow-up is appropriate.
What does an A1C of 6.5% mean?
An A1C of 6.5% meets the laboratory threshold for diabetes and corresponds to about 48 mmol/mol or an eAG near 140 mg/dL. Without clear symptoms, diagnosis usually requires confirmation on another day.
What does an A1C of 7% equal in average blood sugar?
Using the ADAG equation, 7.0% corresponds to an estimated average glucose of about 154 mg/dL or 8.6 mmol/L. The value is an estimate and does not show highs, lows, or glucose variability.
Is an A1C below 7% good for everyone with diabetes?
Seven percent or less is a common reference goal for many adults, but it is not universal. Health status, hypoglycemia risk, age, pregnancy, complications, medications, treatment burden, and personal goals can justify a different target.
Does A1C show blood glucose from today?
No. A1C reflects a weighted average over roughly two to three months. The most recent weeks have more influence, but the test cannot identify a specific meal, day, high, or low reading.
Do I need to fast for an A1C test?
A standard A1C blood test does not normally require fasting. A clinician may order other glucose or lipid tests at the same visit that do require fasting, so follow the instructions for the complete laboratory order.
How often should A1C be checked?
People with stable diabetes treatment commonly have A1C checked at least twice a year. Testing is often repeated about every three months after a treatment change or when the personal goal is not being met. Other situations require individualized timing.
Can anemia make A1C inaccurate?
Yes. Iron-deficiency anemia may raise A1C falsely, while conditions that shorten red-blood-cell lifespan can lower or otherwise distort it. The effect depends on the cause, severity, treatment, and laboratory method.
Why is my A1C higher than my glucose-meter average?
Meter checks may miss times when glucose is higher, and the ADAG conversion describes a population average rather than every individual. Red-blood-cell factors or assay interference can also contribute to a mismatch.
Can A1C diagnose gestational diabetes?
A1C is not the standard test for diagnosing gestational diabetes. Pregnancy uses specific glucose challenge or oral glucose tolerance testing, and pregnancy A1C goals differ from nonpregnant diagnostic ranges.
Is eAG the same as a CGM average?
No. eAG is calculated from A1C using a population equation. A CGM average comes from sensor readings during a defined wear period and can also show time in range, trends, and variability.
Sources
Five core references appear below. Additional standards named beneath individual tables are shown as plain text without outbound links.
1. National Institute of Diabetes and Digestive and Kidney Diseases
The A1C Test & Diabetes
A1C definition, diagnostic thresholds, confirmation, test precision, pregnancy limitations, weighted timing, and factors that affect results.
https://www.niddk.nih.gov/health-information/diagnostic-tests/a1c-test
2. National Institute of Diabetes and Digestive and Kidney Diseases
Diabetes Tests & Diagnosis
Comparison of diagnostic tests, fasting requirements, A1C limitations, and interpretation of discordant results.
https://www.niddk.nih.gov/health-information/diabetes/overview/tests-diagnosis
3. American Diabetes Association
eAG/A1C Conversion Calculator
ADAG equation, official conversion examples, and background on translating A1C into estimated average glucose.
https://professional.diabetes.org/glucose_calc
4. American Diabetes Association Professional Practice Committee for Diabetes
Glycemic Goals, Hypoglycemia, and Hyperglycemic Crises: Standards of Care in Diabetes—2026
Current recommendations for individualized A1C goals, including situations where lower or less stringent goals may be appropriate.
https://diabetesjournals.org/care/article/49/Supplement_1/S132/163927/6-Glycemic-Goals-Hypoglycemia-and-Hyperglycemic
5. NGSP
HbA1c Assay Interferences
Method-specific information about hemoglobin variants and other factors that can produce falsely high or low A1C results.
https://ngsp.org/interf.asp