Health & Medical · Infant growth reference
Baby Growth Percentile Chart: Weight, Length, and Head Circumference
Compare WHO baby growth percentiles from birth through 24 months, understand what each percentile means, and review weight, recumbent length, head circumference, corrected age, measurement technique, and growth-pattern warning signs.
A percentile is not a diagnosis. Do not change feeding, formula concentration, supplements, or medical care from an online chart. A pediatric clinician should confirm measurements and interpret the full growth curve. Read the ChartsLoom Disclaimer.
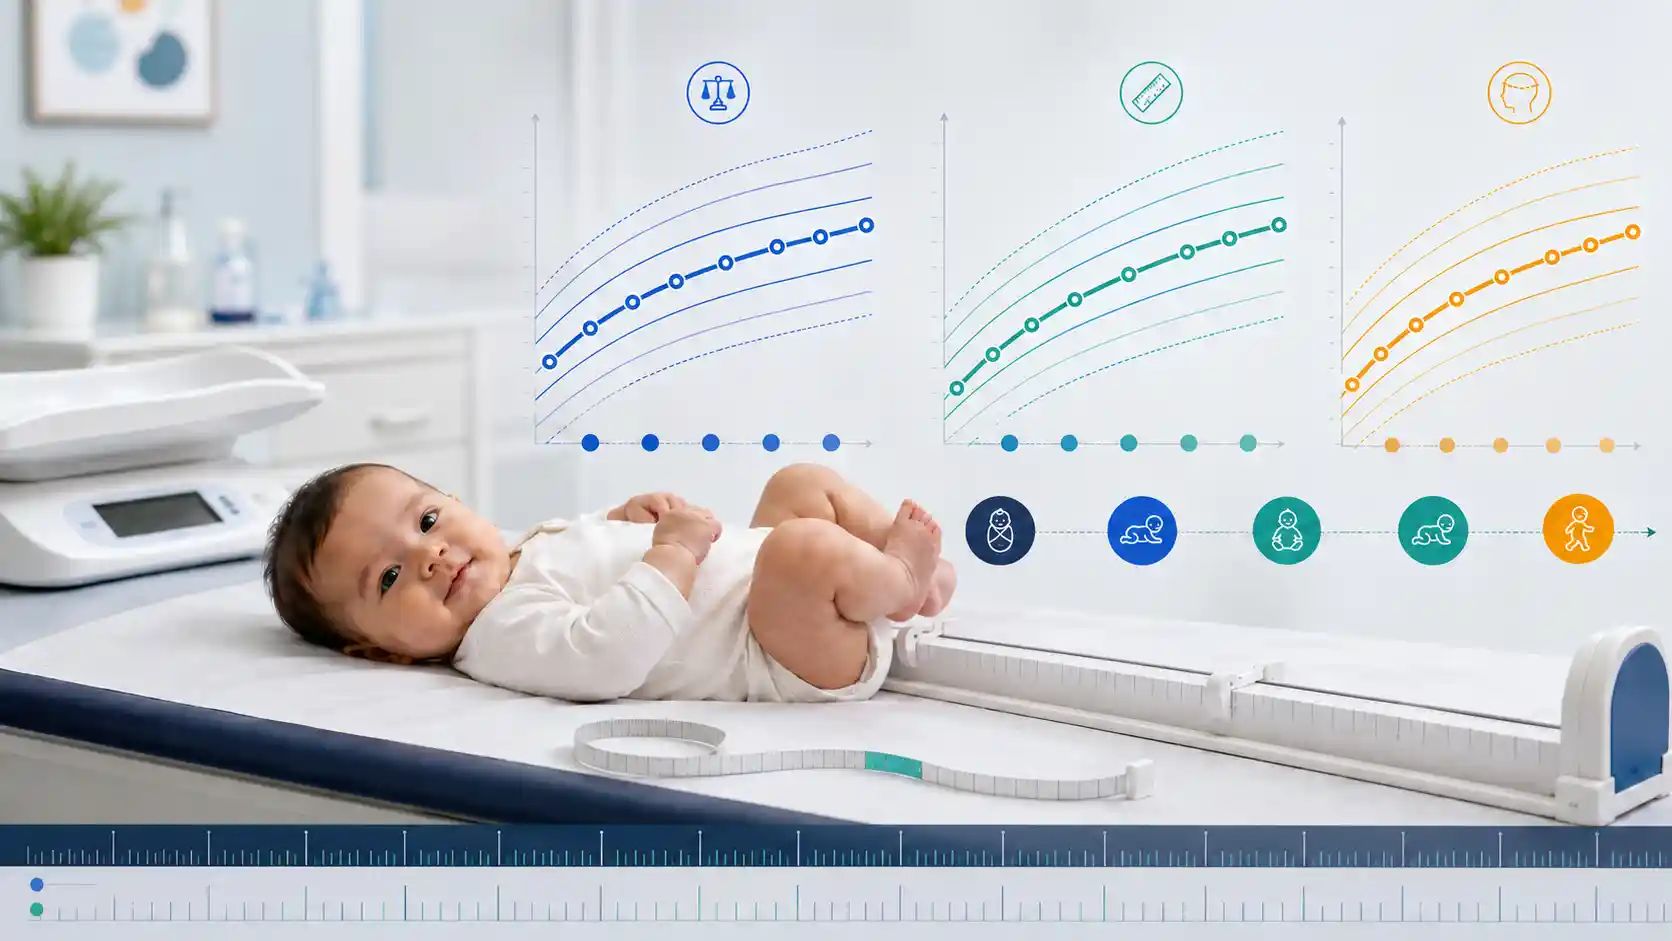
What is a normal baby growth percentile?
There is no single ideal percentile. Healthy babies can grow near the 5th, 50th, or 95th percentile when measurements remain accurate and the growth pattern stays reasonably consistent.
A percentile ranks one measurement against a reference population of infants of the same sex and age. It does not show how much of a target a baby has achieved. The 50th percentile is the median, not a goal. Clinicians combine weight, length, head circumference, weight-for-length, feeding, development, gestational history, family growth patterns, and repeated measurements.
- Weight reference
- Weight-for-age
- Length reference
- Recumbent length-for-age
- Proportional growth
- Weight-for-length
- Best interpretation
- Trend over time
Compares a baby’s weight with infants of the same sex and completed month. It does not account for body length.
Babies younger than 2 years are measured lying down. Standing height begins when clinicians transition to CDC charts.
Compares weight with body length and is the recommended proportional-growth indicator before age 2.
A series of accurate measurements provides more information than one isolated percentile or a home estimate.
How to use this baby growth chart
- 1. Use completed age. Plot birth as month 0 and use the completed month from 1 through 24.
- 2. Match the indicator. Weight-for-age, length-for-age, weight-for-length, and head circumference answer different questions.
- 3. Check the method. Small errors in length or head circumference can move the plotted percentile.
- 4. Follow the curve. Compare repeated professional measurements rather than treating one percentile as a pass-or-fail result.
Baby weight percentile chart from birth to 24 months
WHO weight-for-age reference values for girls and boys at selected completed months. The 2nd, 50th, and 98th percentile columns show the lower cutoff, median, and upper cutoff used on CDC-adapted WHO charts.
Swipe horizontally inside the table to view every column.
| Age | Girls 2nd percentile | Girls 50th percentile | Girls 98th percentile | Boys 2nd percentile | Boys 50th percentile | Boys 98th percentile |
|---|---|---|---|---|---|---|
| Birth | 2.4 kg (5.3 lb) | 3.2 kg (7.1 lb) — Median birth weight for girls | 4.2 kg (9.3 lb) | 2.5 kg (5.4 lb) | 3.3 kg (7.4 lb) — Median birth weight for boys | 4.4 kg (9.7 lb) |
| 1 month | 3.2 kg (7.0 lb) | 4.2 kg (9.2 lb) | 5.5 kg (12.1 lb) | 3.4 kg (7.5 lb) | 4.5 kg (9.9 lb) | 5.8 kg (12.8 lb) |
| 2 months | 3.9 kg (8.7 lb) | 5.1 kg (11.3 lb) | 6.6 kg (14.6 lb) | 4.3 kg (9.5 lb) | 5.6 kg (12.3 lb) | 7.1 kg (15.6 lb) |
| 3 months | 4.5 kg (10.0 lb) | 5.8 kg (12.9 lb) | 7.5 kg (16.6 lb) | 5.0 kg (11.1 lb) | 6.4 kg (14.1 lb) | 8.0 kg (17.7 lb) |
| 4 months | 5.0 kg (11.1 lb) | 6.4 kg (14.2 lb) | 8.2 kg (18.2 lb) | 5.6 kg (12.3 lb) | 7.0 kg (15.4 lb) | 8.7 kg (19.3 lb) |
| 5 months | 5.4 kg (11.9 lb) | 6.9 kg (15.2 lb) | 8.8 kg (19.5 lb) | 6.0 kg (13.2 lb) | 7.5 kg (16.6 lb) | 9.3 kg (20.6 lb) |
| 6 months | 5.7 kg (12.6 lb) | 7.3 kg (16.1 lb) | 9.3 kg (20.6 lb) | 6.4 kg (14.0 lb) | 7.9 kg (17.5 lb) | 9.8 kg (21.7 lb) |
| 9 months | 6.5 kg (14.3 lb) | 8.2 kg (18.1 lb) | 10.5 kg (23.3 lb) | 7.1 kg (15.8 lb) | 8.9 kg (19.6 lb) | 11.0 kg (24.3 lb) |
| 12 months | 7.0 kg (15.5 lb) | 8.9 kg (19.7 lb) | 11.5 kg (25.4 lb) | 7.7 kg (17.1 lb) | 9.6 kg (21.3 lb) | 12.0 kg (26.4 lb) |
| 15 months | 7.6 kg (16.7 lb) | 9.6 kg (21.2 lb) | 12.4 kg (27.3 lb) | 8.3 kg (18.2 lb) | 10.3 kg (22.7 lb) | 12.8 kg (28.3 lb) |
| 18 months | 8.1 kg (17.8 lb) | 10.2 kg (22.6 lb) | 13.2 kg (29.1 lb) | 8.8 kg (19.3 lb) | 10.9 kg (24.1 lb) | 13.7 kg (30.1 lb) |
| 21 months | 8.6 kg (18.9 lb) | 10.9 kg (23.9 lb) | 14.0 kg (30.9 lb) | 9.2 kg (20.3 lb) | 11.5 kg (25.5 lb) | 14.5 kg (31.9 lb) |
| 24 months | 9.0 kg (19.9 lb) | 11.5 kg (25.3 lb) | 14.8 kg (32.7 lb) | 9.7 kg (21.3 lb) | 12.2 kg (26.8 lb) | 15.3 kg (33.7 lb) |
Weight appears in kilograms with pounds in parentheses. Values are rounded to one decimal place for practical reading.
- • Weight-for-age compares body weight with infants of the same sex and completed month of age. It does not account for length and cannot identify high weight-for-length by itself.
- • A single point does not diagnose poor growth. Clinicians interpret serial measurements, feeding history, birth history, illness, and the shape of the growth curve.
- • The underlying CDC files provide more percentile lines and LMS parameters than this concise table.
Download or export
How much should a baby weigh by age?
A baby’s expected weight is a percentile range, not one required number. At 12 months, the WHO median is about 8.9 kg for girls and 9.6 kg for boys.
The table also shows that the reference range is wide. At the same age, a lower or higher weight can still fit an individual growth pattern. Weight-for-age alone cannot show whether weight is proportionate to length, so clinicians also plot weight-for-length before age 2.
Baby length percentile chart from birth to 24 months
WHO recumbent length-for-age values for girls and boys. Babies younger than 2 years are measured lying down, so these values are length rather than standing height.
Swipe horizontally inside the table to view every column.
| Age | Girls 2nd percentile | Girls 50th percentile | Girls 98th percentile | Boys 2nd percentile | Boys 50th percentile | Boys 98th percentile |
|---|---|---|---|---|---|---|
| Birth | 45.4 cm (17.9 in) | 49.1 cm (19.3 in) | 52.9 cm (20.8 in) | 46.1 cm (18.1 in) | 49.9 cm (19.6 in) | 53.7 cm (21.1 in) |
| 1 month | 49.8 cm (19.6 in) | 53.7 cm (21.1 in) | 57.6 cm (22.7 in) | 50.8 cm (20.0 in) | 54.7 cm (21.5 in) | 58.6 cm (23.1 in) |
| 2 months | 53.0 cm (20.9 in) | 57.1 cm (22.5 in) | 61.1 cm (24.1 in) | 54.4 cm (21.4 in) | 58.4 cm (23.0 in) | 62.4 cm (24.6 in) |
| 3 months | 55.6 cm (21.9 in) | 59.8 cm (23.5 in) | 64.0 cm (25.2 in) | 57.3 cm (22.6 in) | 61.4 cm (24.2 in) | 65.5 cm (25.8 in) |
| 4 months | 57.8 cm (22.7 in) | 62.1 cm (24.4 in) | 66.4 cm (26.1 in) | 59.7 cm (23.5 in) | 63.9 cm (25.2 in) | 68.0 cm (26.8 in) |
| 5 months | 59.6 cm (23.5 in) | 64.0 cm (25.2 in) | 68.5 cm (27.0 in) | 61.7 cm (24.3 in) | 65.9 cm (25.9 in) | 70.1 cm (27.6 in) |
| 6 months | 61.2 cm (24.1 in) | 65.7 cm (25.9 in) | 70.3 cm (27.7 in) | 63.3 cm (24.9 in) | 67.6 cm (26.6 in) | 71.9 cm (28.3 in) |
| 9 months | 65.3 cm (25.7 in) | 70.1 cm (27.6 in) | 75.0 cm (29.5 in) | 67.5 cm (26.6 in) | 72.0 cm (28.3 in) | 76.5 cm (30.1 in) |
| 12 months | 68.9 cm (27.1 in) | 74.0 cm (29.1 in) | 79.2 cm (31.2 in) | 71.0 cm (28.0 in) | 75.7 cm (29.8 in) | 80.5 cm (31.7 in) |
| 15 months | 72.0 cm (28.4 in) | 77.5 cm (30.5 in) | 83.0 cm (32.7 in) | 74.1 cm (29.2 in) | 79.1 cm (31.2 in) | 84.2 cm (33.2 in) |
| 18 months | 74.9 cm (29.5 in) | 80.7 cm (31.8 in) | 86.5 cm (34.1 in) | 76.9 cm (30.3 in) | 82.3 cm (32.4 in) | 87.7 cm (34.5 in) |
| 21 months | 77.5 cm (30.5 in) | 83.7 cm (32.9 in) | 89.8 cm (35.4 in) | 79.4 cm (31.3 in) | 85.1 cm (33.5 in) | 90.9 cm (35.8 in) |
| 24 months | 80.0 cm (31.5 in) | 86.4 cm (34.0 in) | 92.9 cm (36.6 in) | 81.7 cm (32.2 in) | 87.8 cm (34.6 in) | 93.9 cm (37.0 in) |
Recumbent length appears in centimeters with inches in parentheses. Values are rounded to one decimal place.
- • Length-for-age describes linear growth. A length below the 2nd percentile may be classified as short stature on WHO charts, but measurement error and family growth patterns require clinical context.
- • Recumbent length usually measures about 0.8 cm, or roughly one-quarter inch, more than standing height. The measurement method changes at age 2.
- • Two trained people and an infant length board provide more reliable measurements than a tape measure used at home.
Download or export
How is baby length different from height?
Baby length is measured lying down from the crown of the head to the heels. Standing height begins at age 2 and usually measures slightly less.
CDC notes that standing height is about 0.8 cm, or roughly one-quarter inch, less than recumbent length on average. This method change can alter the percentile displayed when a child transitions from WHO to CDC charts.
Baby head circumference percentile chart
WHO head-circumference-for-age values for girls and boys from birth to 24 months at selected ages. The tape should pass above the eyebrows and ears and around the largest part of the back of the head.
Swipe horizontally inside the table to view every column.
| Age | Girls 2nd percentile | Girls 50th percentile | Girls 98th percentile | Boys 2nd percentile | Boys 50th percentile | Boys 98th percentile |
|---|---|---|---|---|---|---|
| Birth | 31.5 cm (12.4 in) | 33.9 cm (13.3 in) | 36.2 cm (14.3 in) | 31.9 cm (12.6 in) | 34.5 cm (13.6 in) | 37.0 cm (14.6 in) |
| 1 month | 34.2 cm (13.5 in) | 36.5 cm (14.4 in) | 38.9 cm (15.3 in) | 34.9 cm (13.8 in) | 37.3 cm (14.7 in) | 39.6 cm (15.6 in) |
| 2 months | 35.8 cm (14.1 in) | 38.3 cm (15.1 in) | 40.7 cm (16.0 in) | 36.8 cm (14.5 in) | 39.1 cm (15.4 in) | 41.5 cm (16.3 in) |
| 3 months | 37.1 cm (14.6 in) | 39.5 cm (15.6 in) | 42.0 cm (16.5 in) | 38.1 cm (15.0 in) | 40.5 cm (16.0 in) | 42.9 cm (16.9 in) |
| 4 months | 38.1 cm (15.0 in) | 40.6 cm (16.0 in) | 43.1 cm (17.0 in) | 39.2 cm (15.5 in) | 41.6 cm (16.4 in) | 44.0 cm (17.3 in) |
| 5 months | 38.9 cm (15.3 in) | 41.5 cm (16.3 in) | 44.0 cm (17.3 in) | 40.1 cm (15.8 in) | 42.6 cm (16.8 in) | 45.0 cm (17.7 in) |
| 6 months | 39.6 cm (15.6 in) | 42.2 cm (16.6 in) | 44.8 cm (17.6 in) | 40.9 cm (16.1 in) | 43.3 cm (17.1 in) | 45.8 cm (18.0 in) |
| 9 months | 41.2 cm (16.2 in) | 43.8 cm (17.3 in) | 46.5 cm (18.3 in) | 42.5 cm (16.7 in) | 45.0 cm (17.7 in) | 47.5 cm (18.7 in) |
| 12 months | 42.2 cm (16.6 in) | 44.9 cm (17.7 in) | 47.6 cm (18.7 in) | 43.5 cm (17.1 in) | 46.1 cm (18.1 in) | 48.6 cm (19.1 in) |
| 15 months | 42.9 cm (16.9 in) | 45.7 cm (18.0 in) | 48.4 cm (19.1 in) | 44.2 cm (17.4 in) | 46.8 cm (18.4 in) | 49.4 cm (19.5 in) |
| 18 months | 43.5 cm (17.1 in) | 46.2 cm (18.2 in) | 49.0 cm (19.3 in) | 44.7 cm (17.6 in) | 47.4 cm (18.7 in) | 50.0 cm (19.7 in) |
| 21 months | 44.0 cm (17.3 in) | 46.7 cm (18.4 in) | 49.5 cm (19.5 in) | 45.2 cm (17.8 in) | 47.8 cm (18.8 in) | 50.5 cm (19.9 in) |
| 24 months | 44.4 cm (17.5 in) | 47.2 cm (18.6 in) | 50.0 cm (19.7 in) | 45.5 cm (17.9 in) | 48.3 cm (19.0 in) | 51.0 cm (20.1 in) |
Head circumference appears in centimeters with inches in parentheses. Values are rounded to one decimal place.
- • Head circumference tracks skull and brain growth indirectly. Clinicians consider the trend, family head size, gestational age, and physical examination.
- • Repeat the measurement when the tape is loose, crosses the ears, or does not capture the maximum circumference.
- • A percentile outside the central range does not establish a diagnosis, but rapid crossing of percentile lines or an unusual head-growth pattern deserves medical review.
Download or export
Why clinicians track head circumference
Head circumference provides an indirect measure of skull and brain growth. The measurement uses a nonstretch tape around the largest head circumference, above the eyebrows and ears and across the most prominent part at the back.
One low or high percentile may reflect family head size or measurement variation. A rapid change, repeated crossing of percentile lines, or an unusual pattern deserves professional review, especially when accompanied by vomiting, seizures, unusual sleepiness, or a bulging fontanelle.
Visual baby growth percentile scale
Percentile position describes rank. The direction of the curve across repeated visits usually matters more than whether one point sits near the middle.
Below 2nd
Lower cutoff zone
Requires indicator-specific review and confirmation of accurate measurement.
2nd–10th
Lower percentile range
Can be normal when the baby follows a stable curve and other findings are reassuring.
10th–90th
Central reference range
Contains most reference infants but is not the only range compatible with healthy growth.
90th–98th
Upper percentile range
Can reflect normal family size or a higher measurement that needs context.
Above 98th
Upper cutoff zone
Weight-for-length above this cutoff is classified as high on WHO charts for children under 2.
A healthy baby does not need to stay at the 50th percentile. Clinicians look for accurate measurements, a coherent growth trajectory, adequate feeding, development, and the absence of concerning symptoms.
Chart sources: CDC interpretation guidance and WHO Child Growth Standards.
Baby growth percentile lookup
Estimate a percentile band for weight-for-age, recumbent length-for-age, or head circumference-for-age from birth through 24 completed months.
Use an accurate measurement and completed month of age. The lookup interpolates between selected WHO percentile lines; it does not reproduce the exact LMS calculation used by clinicians.
Estimated reference position
Approximately the 50th percentile
This result ranks one measurement against WHO reference values for girls at 6 completed months. It does not assess weight-for-length, growth velocity, feeding adequacy, or health by itself.
2nd percentile
5.7 kg
50th percentile
7.3 kg
98th percentile
9.3 kg
Clinical limit: Do not change feeding, formula concentration, supplements, or medical care from this estimate. A pediatric clinician should confirm measurements and interpret the full growth curve.
Why the lookup result may differ from a clinic chart
The browser tool interpolates between selected percentile lines at completed months. Clinical software can use exact age in days, sex-specific LMS parameters, higher measurement precision, corrected age, and specialized charts for preterm or medically complex infants. Small input differences can change the displayed percentile.
What baby growth percentiles mean
Percentiles rank a measurement relative to the reference population. They do not grade health, intelligence, feeding quality, or parenting.
Swipe horizontally inside the table to view every column.
| Percentile result | Plain-language meaning | Clinical interpretation | What it does not mean |
|---|---|---|---|
| 2nd percentile | About 2 of 100 reference infants have a lower value and about 98 have a higher value. | This is the WHO lower cutoff used for selected indicators, such as low weight-for-length or short length-for-age. | It does not automatically mean illness, malnutrition, or failure to thrive. |
| 10th percentile | About 10 of 100 reference infants have a lower value. | Often within the expected distribution when the child follows a stable curve and other findings are reassuring. | It does not mean the baby is 10% of an expected size. |
| 50th percentile — Median reference percentile | Half of reference infants have a lower value and half have a higher value. | This is the median, not a target every baby should reach. | It does not mean average health or ideal growth. |
| 90th percentile | About 90 of 100 reference infants have a lower value. | May reflect normal family size or a higher measurement that should be interpreted with other indicators. | It does not prove overweight, overfeeding, or excessive growth. |
| 98th percentile | About 98 of 100 reference infants have a lower value. | This is the WHO upper cutoff for high weight-for-length in children younger than 2 years. | Weight-for-age or head circumference at this percentile requires indicator-specific interpretation rather than an automatic diagnosis. |
Percentiles range from 0 to 100. A percentile is a rank, not a percentage of a target measurement.
- • WHO cutoffs correspond approximately to 2 standard deviations below or above the median and are labeled as the 2nd and 98th percentiles.
- • Growth velocity and repeated measurements usually matter more than one isolated percentile.
- • Weight, length, head circumference, and weight-for-length answer different questions.
Download or export
Percentile is not the same as percentage
The 25th percentile does not mean a baby has reached 25% of expected growth. It means approximately 25% of the reference population has a lower measurement and 75% has a higher measurement. The percentile describes rank only.
This differs from a laboratory reference such as the A1C Chart for blood glucose ranges, where fixed measurement categories help describe screening or treatment context. Growth charts use age- and sex-specific curves that change continuously as a baby grows.
Which baby growth measurement answers which question?
Clinicians plot several measurements because no single percentile describes an infant's complete growth pattern.
Swipe horizontally inside the table to view every column.
| Growth indicator | What it compares | Best use from birth to 2 years | Important limitation |
|---|---|---|---|
| Weight-for-age | Weight compared with sex and completed age | Tracks weight gain over time and helps identify a changing weight trajectory. | Cannot distinguish a short, proportionate baby from low weight relative to length. |
| Length-for-age | Recumbent length compared with sex and completed age | Tracks linear growth and helps identify short or unusually long length for age. | Sensitive to measurement technique, leg position, and movement. |
| Weight-for-length | Weight compared with the baby's recumbent length | Assesses proportionality; WHO cutoffs identify low values below the 2nd percentile and high values above the 98th percentile. | Requires accurate weight and length measured near the same time. |
| Head circumference-for-age | Maximum head circumference compared with sex and age | Tracks head-growth pattern during infancy. | Does not directly measure brain function and requires correct tape placement. |
| BMI-for-age | Weight adjusted for squared length or height | Used on CDC charts after age 2 when standing height replaces recumbent length. | CDC does not recommend BMI-for-age for children younger than 2 years. |
Indicators use sex-specific WHO standards from birth to age 2 in U.S. clinical practice.
- • Clinicians usually plot measurements at repeated well-child visits rather than interpreting values from memory or a single home measurement.
- • At age 2, providers transition to CDC charts and interpret any apparent percentile shift cautiously.
Download or export
Why weight-for-length matters before age 2
Weight-for-length asks whether weight is proportionate to recumbent length. On WHO charts, a value below the 2nd percentile is classified as low weight-for-length, while a value above the 98th percentile is classified as high weight-for-length. Weight-for-age alone cannot provide this proportional assessment.
CDC does not recommend BMI-for-age for children younger than 2 years. At age 2, clinicians move to standing height, CDC growth charts, and BMI-for-age, so the displayed classification may shift even when the child’s underlying growth remains appropriate.
How to measure baby growth accurately
Small technique differences can change an infant's plotted percentile, especially for length and head circumference.
Swipe horizontally inside the table to view every column.
| Measurement | Recommended method | Common error | Quality check |
|---|---|---|---|
| Weight | Use a calibrated infant scale, remove clothing and diaper when clinically appropriate, center the baby, and record the stabilized reading. | Holding the baby on an adult scale, weighing after a feed, or leaving heavy clothing on. | Use the same scale when practical and record kilograms precisely before converting units. |
| Recumbent length | Use a firm length board with the head against the fixed headpiece, shoulders flat, legs straight, and feet against the movable footboard. | Using a flexible tape, bending the knees, pointing the toes, or measuring without a second person. | Repeat the measurement if the infant moved or the two readings differ meaningfully. |
| Head circumference | Use a nonstretch tape above the eyebrows, above the ears, and around the largest occipital prominence. | Placing the tape diagonally, over hair accessories, or below the largest back-of-head point. | Take repeated measurements and record the largest technically correct value. |
| Age | Use exact date of birth and measurement date; use corrected age when the clinical team recommends it for a child born preterm. | Rounding age too early, using calendar year only, or ignoring prematurity. | Plot completed age consistently with the selected chart and clinical system. |
Clinical charts use kilograms, centimeters, exact age, and sex-specific standards.
- • Home measurements can help document a question but should not replace standardized clinic measurements.
- • Measure trends under similar conditions whenever possible.
Download or export
Can parents measure baby growth at home?
Home measurements can document a concern, but clinic equipment and standardized technique provide more reliable percentiles.
Adult bathroom scales, flexible tape measures, clothing, diapers, recent feeds, bent knees, and inconsistent head-tape placement can produce meaningful errors. Record the method and timing, then compare the result with a professional measurement rather than adjusting feeding independently.
Corrected age examples for babies born preterm
Corrected age adjusts chronological age for the number of weeks a baby was born before 40 weeks. A clinician may use corrected age when interpreting growth and development after preterm birth.
Swipe horizontally inside the table to view every column.
| Gestational age at birth | Weeks early | Chronological age now | Approximate corrected age | Calculation |
|---|---|---|---|---|
| 36 weeks | 4 weeks | 3 months | About 2 months | 3 months minus 1 month |
| 34 weeks | 6 weeks | 4 months | About 2½ months | 4 months minus 6 weeks |
| 32 weeks | 8 weeks | 6 months | About 4 months | 6 months minus 2 months |
| 30 weeks | 10 weeks | 9 months | About 6½ months | 9 months minus 10 weeks |
| 28 weeks | 12 weeks | 12 months | About 9 months | 12 months minus 3 months |
Corrected age = chronological age − weeks born before 40 weeks. These examples use approximate month equivalents.
- • Preterm infants may need specialized preterm growth charts before transition to WHO standards.
- • The duration for using corrected age varies by clinical purpose and individual history. Follow the neonatal or pediatric team's method.
- • Do not use this simplified table to select a neonatal growth chart or evaluate a medically complex infant.
Download or export
Preterm babies may need a different chart or corrected age
Babies born before term may be plotted first on a specialized preterm growth chart and later on WHO standards using corrected age. The correct chart depends on gestational age, postmenstrual age, clinical history, and the care team’s protocol.
Do not compare a very preterm infant directly with the term-baby table without neonatal or pediatric guidance. Corrected age changes the age coordinate; it does not change the measured weight, length, or head circumference.
When a baby growth pattern needs professional review
The direction and consistency of the growth curve often provide more information than a single percentile. These situations deserve discussion with a pediatric clinician.
Swipe horizontally inside the table to view every column.
| Growth pattern or concern | Why it matters | What to do | Urgency |
|---|---|---|---|
| Repeated downward crossing of major percentile lines | May reflect feeding difficulty, illness, absorption problems, inaccurate measurement, or a change in growth velocity. | Arrange a pediatric review with feeding, illness, output, and measurement history. | Prompt appointment; sooner for young infants or ongoing weight loss. |
| Weight-for-length below the 2nd percentile | Falls below the WHO lower cutoff for proportional weight relative to length. | Confirm weight and length, review feeding, and obtain clinical assessment. | Prompt clinical review. |
| Weight-for-length above the 98th percentile | Exceeds the WHO upper cutoff for proportional weight relative to length. | Confirm measurements and review the full growth pattern without restricting infant feeding independently. | Routine or prompt review based on trajectory and clinician advice. |
| Length-for-age below the 2nd percentile | Meets the WHO short-stature cutoff, although genetics and measurement technique influence interpretation. | Repeat accurate length and review family growth pattern and health history. | Discuss at a scheduled visit or sooner if growth is slowing. |
| Rapid or unusual head-circumference change | May indicate measurement error, family pattern, or a condition requiring examination. | Repeat the measurement and contact the pediatric clinician for interpretation. | Prompt review; urgent if accompanied by vomiting, unusual sleepiness, seizures, or a bulging fontanelle. |
| Poor feeding, fewer wet diapers, persistent vomiting, marked sleepiness, or breathing difficulty | Symptoms can signal dehydration or acute illness regardless of percentile. | Seek medical advice based on symptoms rather than waiting for another growth measurement. | Urgent or emergency assessment depending on severity. — Urgent symptoms |
This table describes review triggers, not diagnoses.
- • A stable low or high percentile can be normal for an individual child; a changing trajectory can be more informative.
- • Never reduce feeds, change formula concentration, or start supplements solely from an online percentile result.
Download or export
When symptoms matter more than the percentile
Seek urgent medical care for breathing difficulty, inability to feed, severe lethargy, repeated vomiting, seizure, signs of dehydration, or a bulging fontanelle.
Do not wait for another weight check when a baby appears acutely unwell. For nonemergency concerns such as persistent feeding difficulty, ongoing weight loss, fewer wet diapers, or repeated downward crossing of growth curves, contact the pediatric clinician promptly.
Frequently asked questions about baby growth percentiles
What is a normal baby growth percentile?
There is no single ideal percentile. A baby may grow normally at a low, middle, or high percentile when measurements remain accurate, the curve is reasonably consistent, feeding and development are appropriate, and the clinician finds no concerning signs.
Is the 50th percentile the healthiest?
No. The 50th percentile is the median of the reference population, not a health target. A baby at the 10th or 90th percentile can be healthy, and a baby at the 50th percentile can still need evaluation if the growth trajectory changes sharply.
What does the 10th percentile mean for a baby?
The 10th percentile means about 10% of reference infants of the same sex and age have a lower measurement and about 90% have a higher measurement. It does not mean the baby has reached only 10% of expected growth.
When should WHO baby growth charts be used?
In U.S. clinical practice, CDC and the American Academy of Pediatrics recommend WHO growth standards from birth through 2 years, regardless of whether the infant receives breast milk or formula.
Why are baby growth charts different for girls and boys?
WHO standards use sex-specific distributions because typical weight, length, and head-circumference patterns differ. Use the chart that matches the sex category used by the baby's clinical growth record.
Should I use weight-for-age or weight-for-length?
Weight-for-age tracks weight across time, while weight-for-length assesses weight relative to body length. For children younger than 2 years, weight-for-length is the recommended proportional-growth indicator; BMI-for-age is not recommended.
Can I calculate an exact percentile from this page?
The lookup tool estimates a percentile band from selected WHO reference lines. Clinical systems use exact age, precise measurements, sex-specific LMS calculations, gestational history, and repeated data, so a pediatric record may report a slightly different result.
Why did my baby's percentile change after age 2?
At age 2, clinicians switch from WHO standards to CDC charts, from recumbent length to standing height, and from weight-for-length to BMI-for-age. Those changes can shift the displayed percentile even when growth remains healthy.
How does prematurity affect growth percentiles?
Babies born preterm may be plotted with corrected age and may need a specialized preterm chart before transitioning to WHO standards. The neonatal or pediatric team should choose the chart and correction period.
Can feeding change a baby's percentile?
Feeding intake and feeding effectiveness influence weight gain, but growth also reflects genetics, gestational age, illness, absorption, fluid status, and measurement accuracy. Do not change formula concentration or restrict feeds without professional guidance.
How often should a baby be measured?
Clinicians measure growth at scheduled well-child visits and more often when feeding, illness, prematurity, or growth trajectory requires follow-up. Frequent home weighing can create misleading fluctuations because feeds, diapers, scales, and timing change the result.
When is a baby growth percentile an emergency?
A percentile alone is rarely an emergency. Seek urgent care for breathing difficulty, severe lethargy, repeated vomiting, signs of dehydration, seizure, a bulging fontanelle, or inability to feed. Contact a clinician promptly for ongoing weight loss or a concerning trajectory.
Sources
ChartsLoom uses five authoritative sources for the WHO percentile values, chart-selection rules, cutoff interpretation, measurement context, and preterm growth guidance.
Centers for Disease Control and Prevention
Summary: Using WHO Child Growth StandardsU.S. guidance to use WHO standards from birth to age 2, use weight-for-length rather than BMI for infants, and transition to CDC charts at age 2.
Centers for Disease Control and Prevention
WHO Growth Charts Data FilesSex-specific LMS values and selected percentiles for weight-for-age, length-for-age, weight-for-length, and head circumference from birth to 24 months.
Centers for Disease Control and Prevention
Using WHO Growth Standard ChartsPercentile cutoffs, infant growth-pattern interpretation, feeding-pattern context, and cautions when changing from WHO to CDC charts.
World Health Organization
WHO Child Growth StandardsOfficial growth standards and documentation for weight, length, weight-for-length, head circumference, BMI, and growth velocity.
American Academy of Pediatrics
Term and Preterm Infant Growth ToolsClinical guidance on growth-chart selection and corrected age for infants and children born preterm.
The growth curve matters more than one number
Use this chart to understand terms and reference values. Use accurate repeated clinical measurements to understand an individual baby. A stable lower or higher percentile can be normal, while an unexpected change in trajectory may deserve review even when the number remains inside the central range.