Science & Chemistry
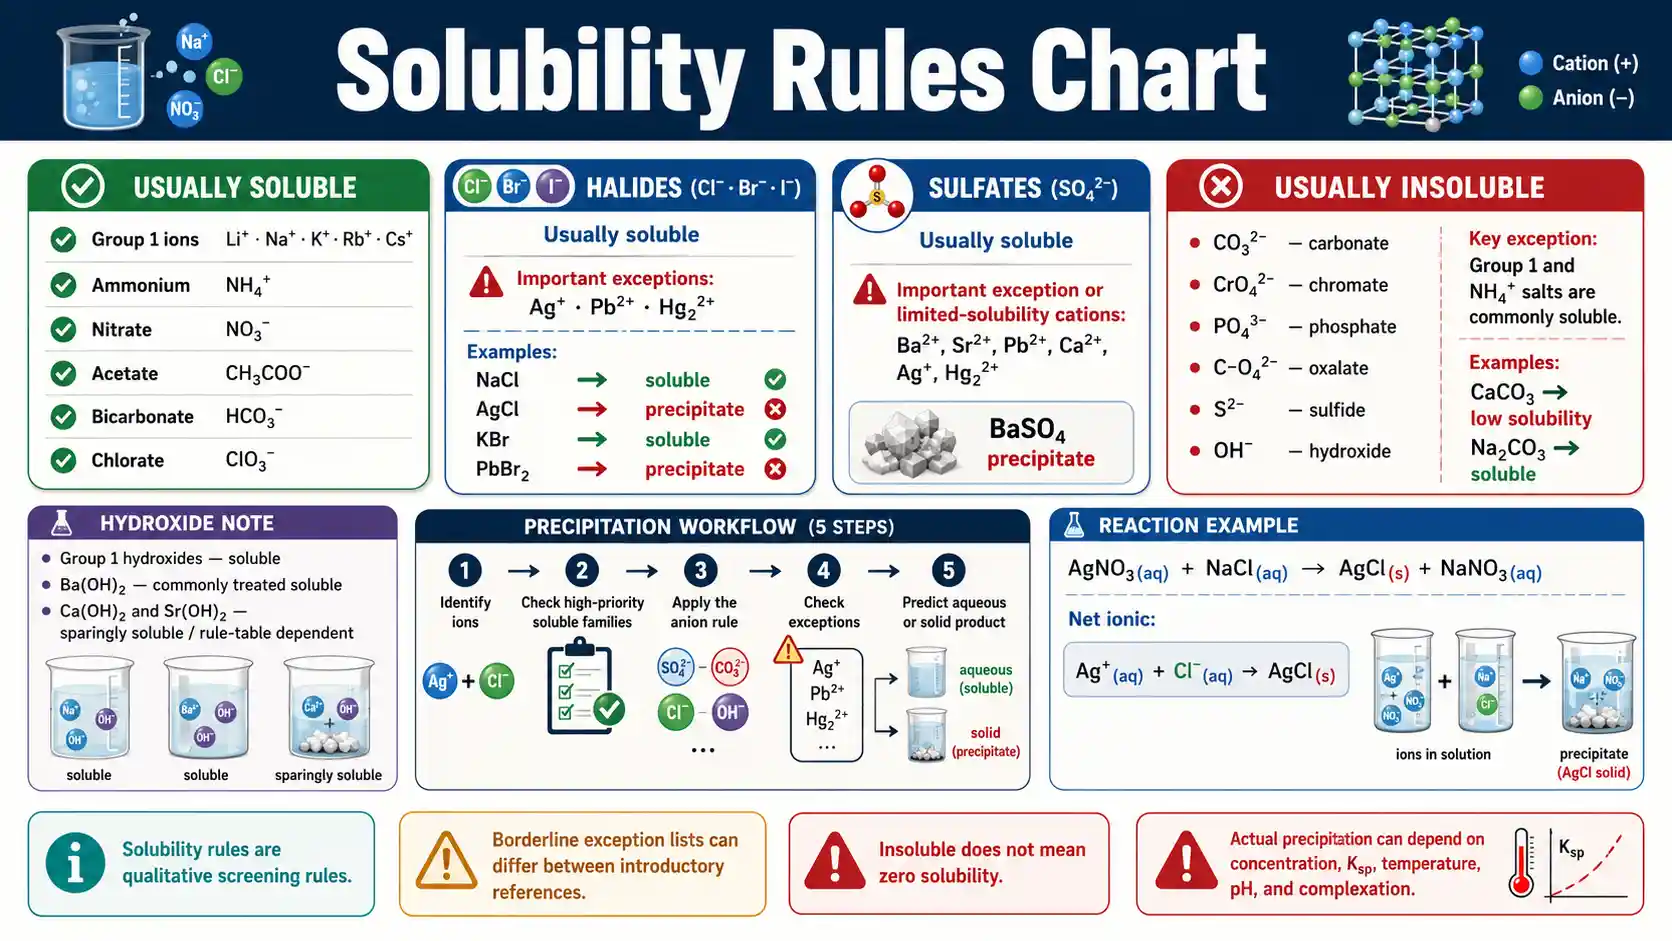
Solubility Chart
Compare reported solubility values, saturation states, composition units, temperature and pressure effects, solubility-product relationships, solvent interactions, and practical calculations without losing the conditions that make each value meaningful.
A solubility number is incomplete without its solvent, composition basis, temperature, and—when relevant—pressure, pH, solid form, or other dissolved species. Do not silently convert g/100 g solvent into g/100 mL or reuse a value at a different temperature.
What solubility tells you
IUPAC defines solubility as the analytical composition of a saturated solution. In practical terms, it is an equilibrium limit for a specified solute-solvent system under specified conditions—not simply the concentration of any solution.
A clear solution can still be unsaturated. A saturated solution is at its equilibrium limit. A supersaturated solution contains more dissolved solute than the equilibrium saturated composition and can crystallize when nucleation begins.
The IUPAC-NIST Solubility Database exists because reliable solubility data are highly system-specific. Temperature, solvent composition, chemical speciation, crystal form, and reporting basis can all change the number you should use.
Solubility and dissolution rate are different properties. Grinding a solid can make it dissolve faster by increasing surface area, but it does not automatically raise the final equilibrium solubility.
Definition
Saturation composition
Equilibrium solubility describes the composition at the saturation limit for specified conditions.
Temperature
System-specific
Many solids become more soluble when heated, but some do not and some show phase-dependent behavior.
Gas pressure
Partial pressure matters
Dilute gas solubility commonly rises with the gas partial pressure under a stated Henry-law convention.
Units
Basis matters
g/100 g solvent, g/L solution, mol/L, molality, and mole fraction are not interchangeable without conversion data.
Representative Aqueous Solubility Values
Selected reported water-solubility values illustrate why temperature and reporting basis must stay attached to every number.
Swipe horizontally inside the table to view every column.
| Substance | Formula | Reported solubility | Temperature | Reporting basis |
|---|---|---|---|---|
| Sodium chloride | NaCl | 36.0 g/100 g water | 25 °C | Mass solute per mass water |
| Potassium nitrate | KNO₃ | 35.7 g/100 mL water | 25 °C | Mass solute per water volume |
| Lithium hydroxide | LiOH | 12.8 g/100 mL water | 20 °C | Mass solute per water volume |
| Sodium acetate, anhydrous | CH₃COONa | 46.5 g/100 mL water | 20 °C | Mass solute per water volume |
| Calcium sulfate, anhydrous | CaSO₄ | 0.2 g/100 mL water | 20 °C | Mass solute per water volume |
| Calcium hydroxide | Ca(OH)₂ | 0.160 g/100 g water | 20 °C | Mass solute per mass water |
Values are reproduced on their reported basis; do not rank them as if g/100 g water and g/100 mL water were identical.
- • Solubility is condition-specific. Hydrate state, crystal form, solvent purity, temperature, pressure, pH, and other dissolved species can change the measured value.
Download or export
Unsaturated, Saturated, and Supersaturated Solutions
The same solute-solvent pair can occupy different solution states depending on composition and conditions.
Swipe horizontally inside the table to view every column.
| State | Relative to equilibrium solubility | Undissolved solid required? | What can happen next? | Key point |
|---|---|---|---|---|
| Unsaturated | Below the equilibrium saturation composition | No | More solute may dissolve | Concentration is below the equilibrium solubility limit |
| Saturated | At the equilibrium saturation composition | May be present as an equilibrium solid phase | Dissolution and crystallization can balance | This state defines equilibrium solubility |
| Supersaturated | Above the equilibrium saturation composition | Not initially | Crystallization or precipitation may occur | Metastable; excess dissolved solute can leave solution |
| With excess undissolved solute | Liquid phase at saturation if equilibrium is reached | Yes | Additional solid remains undissolved | Adding more solid does not raise equilibrium concentration |
Always specify temperature, pressure, solvent, and solute form when defining saturation.
- • IUPAC defines a saturated solution by comparison with a solution in equilibrium with undissolved solute at specified temperature and pressure.
Download or export
Interactive calculator
Solubility Mass Calculator
Enter a solubility expressed as grams of solute per 100 grams of solvent, then compare the equilibrium capacity with the amount of solute you add.
Result
Unsaturated at equilibrium
Capacity
90 g
Dissolved
80 g
Excess solid
0 g
Capacity = solubility × solvent mass ÷ 100. This calculation is valid only when the stated solubility uses the same mass basis and applies at the temperature, pressure, solvent composition, and solid form of interest.
Solubility Units and Composition Bases
Solubility can be expressed using several composition quantities. A number without its basis is incomplete.
Swipe horizontally inside the table to view every column.
| Expression | Meaning | Typical unit | Depends on solution volume? | Useful caution |
|---|---|---|---|---|
| Mass per mass solvent | Solute mass relative to solvent mass | g/100 g solvent | No | Do not treat as g/100 mL without density information |
| Mass concentration | Solute mass per solution volume | g/L solution | Yes | Volume can change with temperature and mixing |
| Amount concentration | Amount of solute per solution volume | mol/L | Yes | Commonly called molarity |
| Molality | Amount of solute per solvent mass | mol/kg solvent | No | Uses solvent mass, not solution mass |
| Mass fraction | Solute mass divided by total mixture mass | kg/kg or dimensionless | No | Often expressed as a percentage |
| Mole fraction | Solute amount divided by total amount | dimensionless | No | Useful in thermodynamics and phase equilibria |
| Mole ratio | Amount of one component divided by another | mol/mol | No | State which components are in numerator and denominator |
IUPAC allows solubility to be expressed by concentration, molality, mole fraction, mole ratio, and other composition quantities.
- • Convert between bases only when the information needed—such as density, molar mass, or total composition—is available.
Download or export
How Temperature Can Change Solubility
Temperature effects are system-specific. Many solids become more soluble on heating, but this is not a universal rule.
Swipe horizontally inside the table to view every column.
| System pattern | Typical temperature response | Example or context | Why it matters | Caution |
|---|---|---|---|---|
| Strong positive slope | Solubility rises markedly as temperature rises | Potassium nitrate in water is a familiar teaching example | Cooling a hot saturated solution can crystallize substantial solute | Use measured data for exact design |
| Weak positive slope | Solubility rises only modestly | Sodium chloride in water changes less dramatically than KNO₃ | Heating may add limited capacity | Do not assume all salts behave like KNO₃ |
| Negative slope | Solubility decreases as temperature rises | Some salts and hydroxides show retrograde behavior over ranges | Heating can promote precipitation | The sign can change with solid phase or range |
| Gas in liquid | Often decreases as temperature rises at fixed pressure | Dissolved gases commonly escape more readily from warm liquids | Cooling often increases gas retention | Exact behavior depends on gas, solvent, pressure, and chemistry |
| Phase-change region | Curve can change abruptly or kink | Hydrate or polymorph transitions can alter the stable solid phase | A single smooth curve may be misleading | Identify the equilibrium solid phase |
Solubility-temperature curves are empirical equilibrium relationships for a specified system.
- • Temperature changes both solution thermodynamics and, sometimes, which solid phase is stable.
Download or export
How to Read a Solubility Curve
A conventional solubility curve plots an equilibrium solubility value against temperature on a fixed composition basis.
Swipe horizontally inside the table to view every column.
| Position relative to curve | Interpretation | If more solute is added | If temperature changes | Common mistake |
|---|---|---|---|---|
| Below curve | Unsaturated | Additional solute may dissolve | Capacity follows the new equilibrium curve value | Calling every clear solution saturated |
| On curve | Saturated at equilibrium | Extra solute remains as solid after equilibrium | Heating or cooling can move the saturation limit | Ignoring equilibration time |
| Above curve with all solute dissolved | Supersaturated | Nucleation may trigger crystallization | Cooling often increases supersaturation for positive-slope systems | Treating a metastable state as the equilibrium limit |
| Above curve with solid present | Not an equilibrium single liquid phase at that composition | Solid/liquid proportions adjust toward equilibrium | Stable phases can change with temperature | Reading total mixture composition as dissolved concentration |
Interpretation assumes the graph basis and stable solid phase are known.
- • A plotted curve does not automatically apply to another hydrate, polymorph, solvent mixture, or pressure.
Download or export
Heating a solution does not guarantee that more solid will dissolve
A positive temperature slope is common in classroom examples such as potassium nitrate, but it is not a universal law. Some systems change only slightly, some become less soluble over a range, and hydrate or polymorph transitions can change the stable solid phase and the shape of the solubility curve.
Gas Solubility: Pressure, Temperature, and Composition
For dilute gas solutions, partial pressure is a major control, but Henry-law constants depend on the gas-solvent pair and temperature.
Swipe horizontally inside the table to view every column.
| Factor | Typical effect on dissolved gas | Reason or model | Example context | Limitation |
|---|---|---|---|---|
| Gas partial pressure increases | Solubility commonly increases in the dilute Henry-law region | Liquid-phase composition is proportional to partial pressure under the chosen Henry-law convention | Carbonated liquids under pressure | Different Henry constants use different definitions and units |
| Temperature increases | Often lowers gas solubility in water | Equilibrium shifts are system-specific | Warm drinks lose dissolved gas readily | Not a universal monotonic rule for every system |
| Salt concentration increases | Often lowers solubility of nonreacting gases | Salting-out effects alter solvent environment | Electrolyte solutions | Magnitude depends on ions and gas |
| Gas reacts with solvent | Apparent uptake can exceed simple physical dissolution | Chemical reaction removes dissolved molecular gas | CO₂ acid-base chemistry in water | Simple Henry-law treatment may be insufficient |
| Solvent changes | Can raise or lower solubility substantially | Intermolecular interactions differ | Organic solvents versus water | Compare data for the same temperature and pressure |
Pressure relationships should use gas partial pressure, not automatically the total gas pressure.
- • IUPAC defines multiple Henry-law constants; always check the convention before comparing numerical values.
Download or export
Solubility Product Expressions
Ksp is written from ion activities for a dissolution equilibrium. Concentration formulas are approximations used under suitable conditions.
Swipe horizontally inside the table to view every column.
| Solid dissolution | Idealized ion ratio | Activity-form product | If molar solubility = s, ideal concentration relation | Key caveat |
|---|---|---|---|---|
| AB(s) ⇌ A⁺ + B⁻ | 1:1 | Ksp = a(A⁺)a(B⁻) | [A⁺] = s; [B⁻] = s | Ksp ≠ s² unless concentration approximates activity |
| AB₂(s) ⇌ A²⁺ + 2B⁻ | 1:2 | Ksp = a(A²⁺)a(B⁻)² | [A²⁺] = s; [B⁻] = 2s | Stoichiometric coefficients become exponents |
| A₂B(s) ⇌ 2A⁺ + B²⁻ | 2:1 | Ksp = a(A⁺)²a(B²⁻) | [A⁺] = 2s; [B²⁻] = s | Common ions change equilibrium concentrations |
| A₃B₂(s) ⇌ 3A²⁺ + 2B³⁻ | 3:2 | Ksp = a(A²⁺)³a(B³⁻)² | [A²⁺] = 3s; [B³⁻] = 2s | Charge balance and side reactions can matter |
| Acid/base-coupled salt | System-specific | Include relevant equilibria | Simple s relation may fail | pH can strongly change apparent solubility |
IUPAC defines solubility product using ion activities in the saturated solution.
- • Do not compare Ksp values as a universal ranking of molar solubility when dissolution stoichiometries differ.
Download or export
Ksp and solubility are related, but they are not interchangeable numbers
IUPAC defines the solubility product from ion activities in the saturated solution. The algebra that converts Ksp to a molar solubility depends on dissolution stoichiometry, and common ions, pH, complexation, and nonideal activity coefficients can change the result.
Solvent and Solute Interactions that Affect Solubility
The phrase “like dissolves like” is a useful first heuristic, but actual solubility reflects competing intermolecular and lattice interactions.
Swipe horizontally inside the table to view every column.
| Interaction or property | Often favors solubility when | Typical systems | What can oppose it | Practical implication |
|---|---|---|---|---|
| Ion-dipole interaction | Polar solvent stabilizes separated ions | Ionic solids in water | Strong crystal lattice, common-ion effects | Polarity alone does not guarantee high salt solubility |
| Hydrogen bonding | Solute and solvent can form favorable H-bonds | Alcohols, polyols, water | Hydrophobic surface area and self-association | More H-bond sites often help but do not set a universal cutoff |
| Dispersion interactions | Solute and solvent have compatible nonpolar character | Hydrocarbons in nonpolar solvents | Strong polarity mismatch | Nonpolar solutes often prefer nonpolar solvents |
| Acid-base reaction | Ionization creates a more strongly solvated form | Weak acids/bases in pH-controlled media | Neutral form may dominate at another pH | Apparent solubility can be pH-dependent |
| Complex formation | Soluble complexes stabilize dissolved species | Metal-ligand systems | Competing precipitation or ligand limits | Total dissolved concentration may exceed free-ion concentration |
| Crystal lattice energy | Lattice is relatively easy to disrupt | Crystalline solids | Strong ionic/covalent packing | Solvent attraction must compete with solid-state stability |
Solubility emerges from the free-energy balance among phases, not from one molecular descriptor alone.
- • Structural similarity is a screening heuristic, not a quantitative solubility law.
Download or export
Solubility Mass Calculation Examples
These examples use the mass basis g solute per 100 g solvent. Keep the basis unchanged when scaling the amount of solvent.
Swipe horizontally inside the table to view every column.
| Given solubility | Solvent mass | Equilibrium capacity | Solute added | Expected result |
|---|---|---|---|---|
| 36.0 g/100 g solvent | 100 g | 36.0 g | 20 g | Unsaturated if all 20 g dissolves |
| 36.0 g/100 g solvent | 100 g | 36.0 g | 36 g | At saturation limit |
| 36.0 g/100 g solvent | 100 g | 36.0 g | 50 g | About 36 g dissolved + 14 g excess at equilibrium |
| 36.0 g/100 g solvent | 250 g | 90.0 g | 80 g | Unsaturated if all 80 g dissolves |
| 36.0 g/100 g solvent | 250 g | 90.0 g | 100 g | About 90 g dissolved + 10 g excess at equilibrium |
| 12.8 g/100 g solvent | 75 g | 9.6 g | 12 g | About 9.6 g dissolved + 2.4 g excess at equilibrium |
Capacity = (reported g solute / 100 g solvent) × solvent mass.
- • Examples are arithmetic demonstrations. A real material requires a valid equilibrium solubility value at the same conditions and on the same reporting basis.
Download or export
Common Solubility Mistakes and Better Checks
Most solubility errors come from missing conditions, incompatible units, or confusing equilibrium with kinetics.
Swipe horizontally inside the table to view every column.
| Mistake | Why it fails | Better check | Example | Risk |
|---|---|---|---|---|
| Reporting a number without temperature | Solubility can vary strongly with temperature | Attach temperature to the value | KNO₃ data at 25 °C should not be used as a 60 °C value | Wrong saturation estimate |
| Mixing g/100 g with g/100 mL | Mass and volume bases are different | Convert only with valid density/composition data | 36 g/100 g water is not automatically 36 g/100 mL water | False ranking or conversion |
| Calling concentration “solubility” | An unsaturated solution can have any lower concentration | Ask whether the solution is saturated at equilibrium | 0.1 M does not itself state the solubility limit | Conceptual error |
| Assuming all solids get more soluble when heated | Temperature dependence is system-specific | Use measured curve or evaluated data | Retrograde solubility exists | Wrong crystallization plan |
| Comparing Ksp values directly across stoichiometries | Ksp-to-s relations depend on ion ratios and activities | Write dissolution equilibrium first | AB and AB₂ do not share the same algebra | Wrong molar-solubility ranking |
| Ignoring pH or complexation | Chemical reactions change dissolved speciation | Model relevant equilibria | Weak acids/bases or metal complexes | Wrong apparent solubility |
| Assuming fast dissolution means high solubility | Rate and equilibrium limit are different properties | Separate kinetics from equilibrium | Powdering can speed dissolution without changing equilibrium solubility | Process-design error |
| Using total pressure instead of gas partial pressure | Henry-law relationships use the solute-gas partial pressure | Use partial pressure and correct constant convention | Gas mixtures | Wrong gas-solubility estimate |
A trustworthy solubility statement includes solute, solvent, composition basis, temperature, pressure when relevant, and phase/form information.
- • For high-accuracy work, use critically evaluated data for the exact chemical system rather than a generic classroom chart.
Download or export
How to use a solubility value correctly
1. Match the chemical system
Confirm the exact solute, solvent, hydrate or polymorph, and any relevant pH, salt, ligand, or cosolvent composition.
2. Match the conditions
Use data at the required temperature and pressure. For gases, use the correct partial pressure and Henry-law convention.
3. Match the composition basis
Keep g/100 g solvent, g/L solution, molality, molarity, and mole fraction distinct unless you have enough information for a valid conversion.
4. Decide what question you are solving
Equilibrium solubility, dissolution rate, precipitation risk, crystallization yield, or gas uptake can require different data and models.
Solubility FAQs
What does solubility mean?
Solubility is the composition of a saturated solution for a specified solute, solvent, temperature, pressure, and other relevant conditions.
Is solubility the same as concentration?
No. Concentration describes the composition of a particular solution; solubility describes the equilibrium saturation limit under stated conditions.
What is a saturated solution?
A saturated solution has the same solute concentration as a solution in equilibrium with undissolved solute at the specified temperature and pressure.
What is an unsaturated solution?
An unsaturated solution is below the equilibrium solubility limit, so more solute can potentially dissolve under the same conditions.
What is a supersaturated solution?
A supersaturated solution contains more dissolved solute than the equilibrium saturated composition at the stated conditions and is therefore metastable.
Does solubility always increase with temperature?
No. Many solids become more soluble as temperature rises, but some show weak, negative, or phase-dependent temperature behavior.
Why do gases often become less soluble when water warms?
For many gas-water systems, warming shifts equilibrium toward the gas phase, so less gas remains dissolved at a fixed partial pressure.
Does pressure affect solid solubility?
For ordinary condensed-phase solid-liquid systems, moderate pressure changes are often much less important than temperature and composition, but pressure can matter in specialized systems.
Does pressure affect gas solubility?
Yes. In the dilute Henry-law region, dissolved gas composition commonly increases with the gas partial pressure above the solution.
What units are used for solubility?
Solubility can be reported as g per 100 g solvent, g/L, mol/L, mol/kg solvent, mass fraction, mole fraction, mole ratio, and other composition quantities.
Can I compare g/100 g water directly with g/100 mL water?
Not reliably. They use different bases, and conversion requires density or other composition information for the relevant solution or solvent.
What is Ksp?
The solubility product is the product of ion activities raised to stoichiometric powers for an ionic solute in its saturated solution.
Does a larger Ksp always mean greater molar solubility?
No. The relation between Ksp and molar solubility depends on dissolution stoichiometry, activities, common ions, pH, and other equilibria.
Can pH change solubility?
Yes. If the solute participates in acid-base equilibria, changing pH can alter ionization and therefore the apparent or total solubility.
Is “like dissolves like” a law?
No. It is a useful heuristic about intermolecular compatibility, but quantitative solubility also depends on crystal stability, speciation, temperature, and other interactions.
How do I use a solubility curve?
Read the equilibrium solubility at the desired temperature using the graph’s stated units, then compare the actual dissolved composition with that curve value.
Sources
Definitions and equilibrium concepts follow IUPAC terminology. Evaluated data context follows the IUPAC-NIST Solubility Database. Selected room-temperature examples preserve the experimental units and temperatures reported in PubChem records.
International Union of Pure and Applied Chemistry — Gold Book — solubility and saturated-solution terminology
Defines solubility as the analytical composition of a saturated solution and links the definition to specified solvent, temperature, and pressure conditions.
https://goldbook.iupac.org/terms/view/S05740
National Institute of Standards and Technology — IUPAC-NIST Solubility Database, SRD 106
Reference database containing critically evaluated solubility and liquid-liquid equilibrium data from the IUPAC-NIST Solubility Data Series.
https://sdrdata.nist.gov/solubility/intro.aspx
National Library of Medicine — PubChem — Compound records with experimental solubility data
Experimental property records used for selected aqueous-solubility examples; original reported units and temperatures are retained rather than normalized silently.
https://pubchem.ncbi.nlm.nih.gov/