Fitness & Sports · Cycling Performance
Cycling Speed Chart for MPH, KM/H, Pace and Ride Time
Convert bicycle speed, calculate moving or elapsed averages, compare ride times, and interpret outdoor pace without turning one number into a universal fitness standard.
Cycling speed does not prove power, fitness, effort, or safety. Choose a speed that fits the route, traffic, surface, visibility, conditions, bike, and your ability to stay in control. Read the ChartsLoom Disclaimer.
What is average cycling speed?
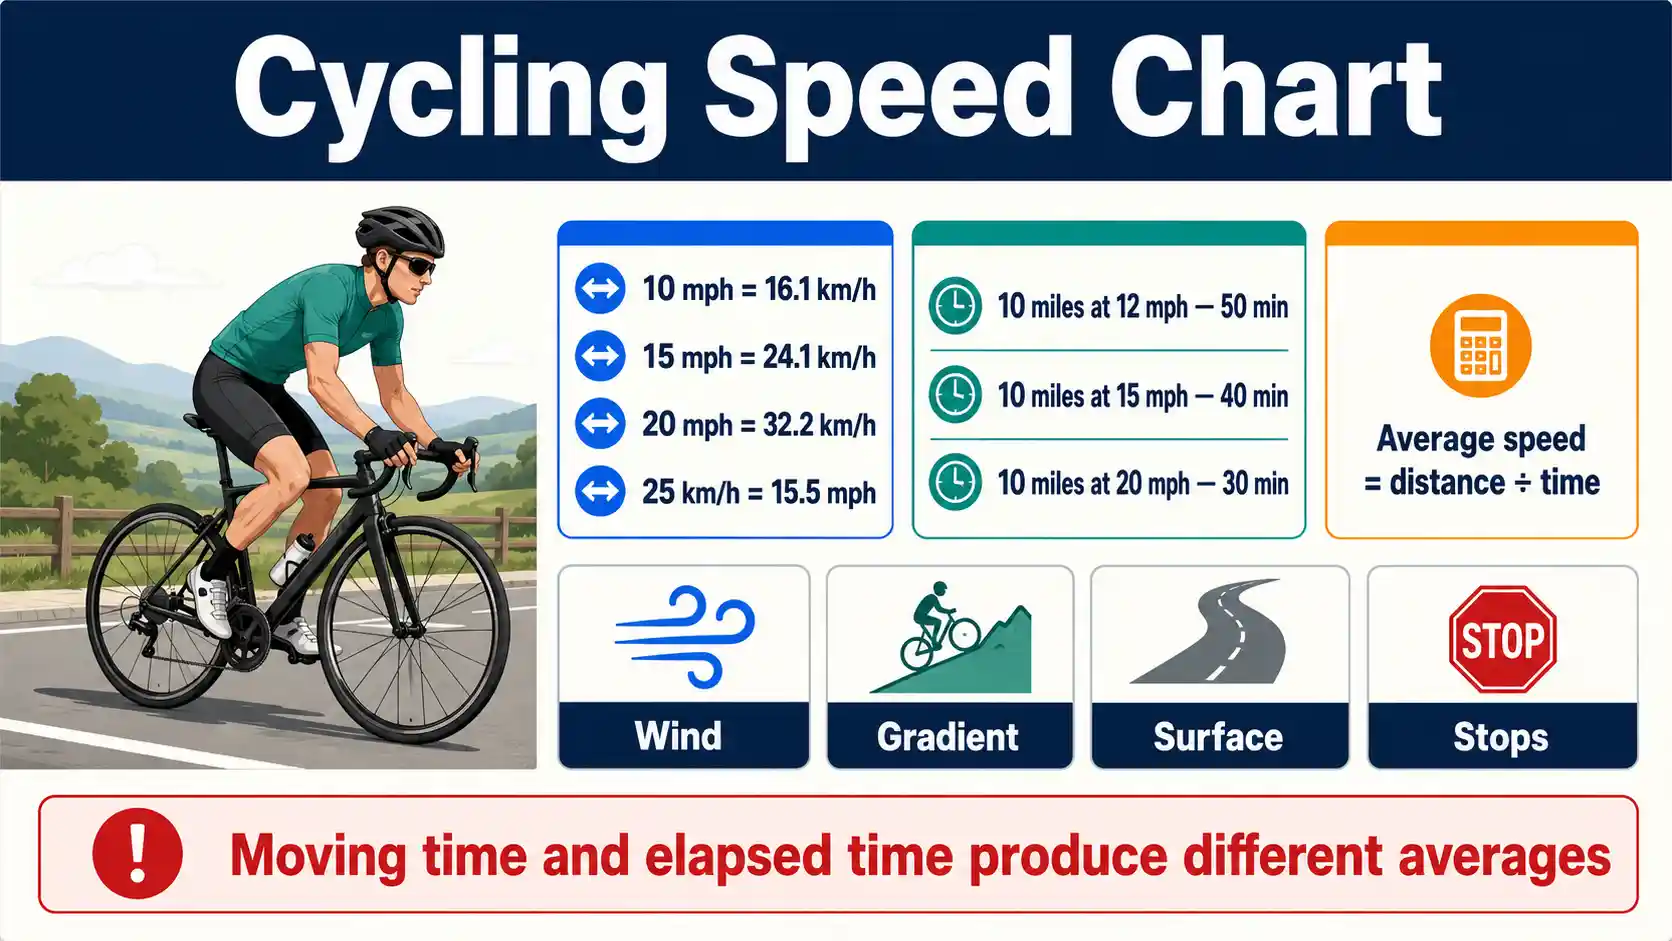
Average cycling speed equals distance divided by time. A 20-mile ride completed in 1 hour 20 minutes averages 15 mph, which equals 24.1 km/h. State whether the time is moving time or full elapsed time.
There is no single normal or good cycling speed for every rider. Road gradient, wind, surface, turns, stops, drafting, bike type, load, and effort can change the result. Use an exact conversion factor and round only the final display, as recommended by NIST unit-conversion guidance.
Average speed
Distance ÷ time
Use one distance unit and express time in hours before dividing.
Exact conversion
1 mph = 1.609344 km/h
Multiply mph by 1.609344; divide km/h by the same factor.
Cycling pace
Time ÷ distance
Pace reports minutes per mile or kilometre. A lower pace is faster.
Road context
Speed is an outcome
Wind, gradient, surface, stops, drafting, equipment, and effort shape it.
Cycling speed conversion chart
Convert a constant average cycling speed between miles per hour, kilometres per hour, pace, and two example ride times.
Swipe horizontally inside the table to view every column.
| Speed (mph) | Speed (km/h) | Pace per mile | Pace per km | Time for 10 mi | Time for 20 km |
|---|---|---|---|---|---|
| 5 | 8.0 | 12:00 | 7:27 | 2:00:00 | 2:29:08 |
| 8 | 12.9 | 7:30 | 4:40 | 1:15:00 | 1:33:12 |
| 10 | 16.1 | 6:00 | 3:44 | 1:00:00 | 1:14:34 |
| 12 | 19.3 | 5:00 | 3:06 | 50:00 | 1:02:08 |
| 14 | 22.5 | 4:17 | 2:40 | 42:51 | 53:16 |
| 15 | 24.1 | 4:00 | 2:29 | 40:00 | 49:43 |
| 16 | 25.7 | 3:45 | 2:20 | 37:30 | 46:36 |
| 18 | 29.0 | 3:20 | 2:04 | 33:20 | 41:25 |
| 20 | 32.2 | 3:00 | 1:52 | 30:00 | 37:17 |
| 22 | 35.4 | 2:44 | 1:42 | 27:16 | 33:54 |
| 25 | 40.2 | 2:24 | 1:29 | 24:00 | 29:50 |
| 30 | 48.3 | 2:00 | 1:15 | 20:00 | 24:51 |
Pace uses minutes:seconds. Ride times use minutes:seconds below one hour and hours:minutes:seconds at one hour or longer.
- • Conversions use 1 mile = 1.609344 kilometres. Displayed km/h values are rounded to one decimal place; time calculations use the unrounded conversion.
- • Every time assumes one constant average speed. Stops, turns, traffic, gradient changes, and slowing are not added.
- • Cycling pace means time per mile or kilometre. A lower pace value represents a higher speed.
Table sources: National Institute of Standards and Technology — Unit Conversion and Exact Conversion-Factor Guidance
Download or export
Cycling speed and ride time calculator
Calculate average speed from a recorded distance and time, or estimate ride time from a target distance and speed. Keep moving and elapsed time separate.
Calculate average speed
Enter either moving time or elapsed time. The label you choose changes the meaning of the result.
20 mi in 1 hr 20 min
Average speed15.00 mph24.14 km/h
Average pace4:00/mi2:29/km
Plan ride time
This is pure riding time at one average speed. Add breaks, traffic, navigation, and a route-specific buffer separately.
50 km at 25.00 km/h (15.53 mph)
Estimated ride time2 hr 0 minClock format 2:00:00
Target pace2:24/km3:52/mi
Formulas: average speed = distance ÷ time; ride time = distance ÷ average speed; pace = time ÷ distance. Unit conversions retain the exact 1.609344 factor and round only displayed results.
Cycling speed, pace, and ride time formulas
Average speed
Speed = distance ÷ time
Convert minutes to hours before dividing. One hour 20 minutes equals 1 + 20 ÷ 60, or 1.3333 hours. Therefore, 20 miles ÷ 1.3333 hours = 15 mph.
Ride time
Time = distance ÷ speed
Fifty kilometres ÷ 25 km/h = 2 hours. This is riding time only unless the average speed already uses elapsed time.
Cycling pace
Pace = time ÷ distance
At 15 mph, pace per mile is 60 ÷ 15 = 4 minutes. At 25 km/h, pace per kilometre is 60 ÷ 25 = 2.4 minutes, or 2:24.
MPH and KM/H conversion
MPH × 1.609344 = KM/H
Multiply mph by 1.609344. Divide km/h by 1.609344. Keep the full factor during the calculation, then round the displayed speed to a useful precision.
Worked example: 30 km in 1 hour 15 minutes
Convert 1 hour 15 minutes to 1.25 hours. Divide 30 km by 1.25 hours to get 24 km/h. Divide 24 by 1.609344 to get 14.91 mph. Pace is 2:30 per km or about 4:01 per mile.
Cycling ride time chart by miles
Estimated ride time when the listed average speed is sustained across the full distance.
Swipe horizontally inside the table to view every column.
| Average speed | 5 miles | 10 miles | 20 miles | 40 miles | 100 miles |
|---|---|---|---|---|---|
| 8 mph | 37:30 | 1:15:00 | 2:30:00 | 5:00:00 | 12:30:00 |
| 10 mph | 30:00 | 1:00:00 | 2:00:00 | 4:00:00 | 10:00:00 |
| 12 mph | 25:00 | 50:00 | 1:40:00 | 3:20:00 | 8:20:00 |
| 14 mph | 21:26 | 42:51 | 1:25:43 | 2:51:26 | 7:08:34 |
| 15 mph | 20:00 | 40:00 | 1:20:00 | 2:40:00 | 6:40:00 |
| 16 mph | 18:45 | 37:30 | 1:15:00 | 2:30:00 | 6:15:00 |
| 18 mph | 16:40 | 33:20 | 1:06:40 | 2:13:20 | 5:33:20 |
| 20 mph | 15:00 | 30:00 | 1:00:00 | 2:00:00 | 5:00:00 |
| 22 mph | 13:38 | 27:16 | 54:33 | 1:49:05 | 4:32:44 |
| 25 mph | 12:00 | 24:00 | 48:00 | 1:36:00 | 4:00:00 |
Times use minutes:seconds below one hour and hours:minutes:seconds at one hour or longer.
- • Time equals distance divided by average speed. The table does not add breaks or a contingency allowance.
- • Use moving average for riding time only. Use elapsed average when the planned arrival time must include stops.
- • A 100-mile ride is an imperial century. Do not confuse it with a 100-kilometre metric century.
Table sources: National Institute of Standards and Technology — Unit Conversion and Exact Conversion-Factor Guidance
Download or export
Cycling ride time chart by kilometres
Estimated ride time when the listed metric average speed is sustained across the full distance.
Swipe horizontally inside the table to view every column.
| Average speed | 5 km | 10 km | 20 km | 50 km | 100 km |
|---|---|---|---|---|---|
| 12 km/h | 25:00 | 50:00 | 1:40:00 | 4:10:00 | 8:20:00 |
| 15 km/h | 20:00 | 40:00 | 1:20:00 | 3:20:00 | 6:40:00 |
| 20 km/h | 15:00 | 30:00 | 1:00:00 | 2:30:00 | 5:00:00 |
| 25 km/h | 12:00 | 24:00 | 48:00 | 2:00:00 | 4:00:00 |
| 30 km/h | 10:00 | 20:00 | 40:00 | 1:40:00 | 3:20:00 |
| 35 km/h | 8:34 | 17:09 | 34:17 | 1:25:43 | 2:51:26 |
| 40 km/h | 7:30 | 15:00 | 30:00 | 1:15:00 | 2:30:00 |
| 45 km/h | 6:40 | 13:20 | 26:40 | 1:06:40 | 2:13:20 |
| 50 km/h | 6:00 | 12:00 | 24:00 | 1:00:00 | 2:00:00 |
Times use minutes:seconds below one hour and hours:minutes:seconds at one hour or longer.
- • Time equals distance divided by average speed. The table assumes the displayed speed applies to the whole route.
- • A 100-kilometre ride is a metric century and equals about 62.1 miles.
- • Add planned stops separately when estimating total door-to-door time.
Table sources: National Institute of Standards and Technology — Unit Conversion and Exact Conversion-Factor Guidance
Download or export
Common cycling speed questions answered
Conversion answers retain the exact 1.609344 factor before rounding. Ride-time answers assume one constant average speed and exclude stops unless stated otherwise.
How fast is 10 mph on a bicycle in km/h?
16.1 km/h
Multiply 10 mph by 1.609344. The exact result is 16.09344 km/h, which rounds to 16.1 km/h.
How fast is 12 mph in km/h?
19.3 km/h
Twelve miles per hour equals 19.312128 km/h, usually shown as 19.3 km/h.
How fast is 15 mph in km/h?
24.1 km/h
Fifteen miles per hour equals 24.14016 km/h. At that constant speed, one mile takes 4 minutes.
How fast is 20 mph in km/h?
32.2 km/h
Twenty miles per hour equals 32.18688 km/h. That speed produces a pace of 3:00 per mile.
How fast is 20 km/h in mph?
12.4 mph
Divide 20 km/h by 1.609344. The result is about 12.43 mph.
How fast is 25 km/h in mph?
15.5 mph
Twenty-five kilometres per hour equals about 15.53 mph and a pace of 2:24 per kilometre.
How fast is 30 km/h in mph?
18.6 mph
Thirty kilometres per hour equals about 18.64 mph. At that speed, 50 km takes 1 hour 40 minutes.
How long does 10 miles take at 12 mph?
50 minutes
Divide 10 miles by 12 mph to get 0.8333 hours, then multiply by 60 to get 50 minutes.
How long does 10 miles take at 15 mph?
40 minutes
Ten miles divided by 15 mph equals two-thirds of an hour, or 40 minutes without stops.
How long does 20 miles take at 15 mph?
1 hour 20 minutes
Twenty miles divided by 15 mph equals 1.3333 hours. Add break time separately for an elapsed-time plan.
How long does 20 km take at 20 km/h?
1 hour
Distance and average speed are both 20 in metric units, so the calculated riding time is exactly one hour.
How long does 50 km take at 25 km/h?
2 hours
Fifty kilometres divided by 25 km/h equals two hours of riding time before stops.
How long does 100 km take at 25 km/h?
4 hours
A 100 km metric century at a constant 25 km/h average takes four moving hours.
Is 12 mph a moderate cycling speed?
It is 8.0 METs in the Compendium
The 12–13.9 mph outdoor category is vigorous by adult absolute MET criteria. Personal effort may still feel different.
Is 20 mph fast on a bicycle?
It is 32.2 km/h, but “fast” depends on context
Route, gradient, wind, drafting, bike, surface, stops, and rider capacity prevent one universal skill label.
Outdoor cycling speed and MET intensity chart
Speed-specific descriptions from the 2024 Adult Compendium, paired with adult absolute-intensity labels.
Swipe horizontally inside the table to view every column.
| Compendium activity description | Speed (mph) | Approx. speed (km/h) | MET | Adult absolute intensity | Interpretation limit |
|---|---|---|---|---|---|
| Leisure, commuting or pleasure | <10 | <16.1 | 4.0 | Moderate | Not a rider-skill grade |
| Leisure, slow, light effort | 10–11.9 | 16.1–19.2 | 6.8 | Vigorous | Relative effort can differ |
| Leisure, moderate effort | 12–13.9 | 19.3–22.4 | 8.0 | Vigorous | Wind and grade remain unmeasured |
| Racing or leisure, fast, vigorous effort | 14–15.9 | 22.5–25.6 | 10.0 | Vigorous | Not a training-zone prescription |
| Racing, not drafting; very fast | 16–19 | 25.7–30.6 | 12.0 | Vigorous | Drafting changes energy cost |
| Racing, not drafting | >20 | >32.2 | 16.8 | Vigorous | Not equivalent to indoor display speed |
- • Moderate absolute intensity is 3.0 to less than 6.0 METs. Vigorous absolute intensity is 6.0 METs or more.
- • Absolute intensity describes the activity’s estimated energy cost. Relative intensity describes how difficult the ride is for the individual.
- • The source speed categories are reproduced as published. Do not fill gaps between source endpoints by inventing a new MET value.
- • Outdoor speed alone cannot isolate power, gradient, wind, surface, drafting, equipment, or rider physiology.
Table sources: Compendium of Physical Activities — 2024 Adult Compendium — Bicycling MET Values; U.S. Department of Health and Human Services — Physical Activity Concepts — Absolute and Relative Intensity
Download or export
A cycling MET category is not a rider category
The 2024 Adult Compendium bicycling table assigns MET values to activity descriptions for energy-expenditure estimation. It does not define beginner, intermediate, advanced, or professional speed standards.
Absolute intensity describes the activity’s estimated energy cost. Relative intensity describes how hard that ride is for the individual. Use perceived effort, the talk test, heart rate, or power when those measures fit the rider and purpose.
Moving average speed versus elapsed average speed
The same ride can produce two correct averages because the time denominator changes. Name the time basis whenever you share, compare, or plan a cycling speed.
Moving average speed
Distance divided by detected moving time. It can exclude complete stops, but the device’s auto-pause threshold and GPS smoothing affect the result.
Elapsed average speed
Distance divided by all time from start to finish. It includes traffic lights, breaks, repairs, navigation, and other stopped time.
Example: a 20-mile ride
Twenty miles in 1 hour 20 minutes of moving time averages 15.0 mph. Add 10 stopped minutes and elapsed time becomes 1 hour 30 minutes, so the elapsed average becomes 13.3 mph. Neither value is wrong; they answer different questions.
What changes average cycling speed?
Speed combines the rider, bicycle, route, environment, and recording method into one number. Record major modifiers before deciding that a faster or slower average represents a performance change.
Gradient and elevation
Climbs usually lower speed; descents may raise it.
Grade changes the power needed to move forward. Descending speed also depends on curves, sight distance, braking, surface, and traffic.
Record: Elevation gain, maximum grade, and route profile.
Wind
A headwind lowers speed at the same effort; a tailwind can raise it.
Apparent air speed changes aerodynamic resistance. A loop route can still have unequal exposure in each direction.
Record: Wind speed, direction, and exposed route sections.
Surface and rolling resistance
Loose, rough, soft, or wet surfaces often reduce speed.
Tire deformation, vibration, traction, and line choice change how much effort reaches forward motion.
Record: Road, gravel, trail, mud, indoor, or mixed surface.
Stops and traffic
Intersections and congestion reduce elapsed average speed.
Repeated braking and acceleration cost time even when an app excludes fully stopped seconds from moving time.
Record: Moving time, elapsed time, and stop duration.
Drafting and riding position
Shelter and a smaller frontal position can raise speed at the same effort.
The speed benefit changes with spacing, group formation, wind angle, clothing, and safe bike handling.
Record: Solo, group, drafting, upright, hoods, or drops.
Bike, tires, and carried load
Setup can change rolling, aerodynamic, and climbing demands.
Bike geometry, tire choice and pressure, luggage, accessories, and mechanical condition all matter.
Record: Bike type, tire setup, load, and major equipment changes.
Power, cadence, and gearing
The same speed can require different power on different routes.
Speed reports the result. Power reports work rate at the pedals, while cadence reports crank revolutions per minute.
Record: Average power, normalized power if used, cadence, and gearing context.
Temperature and air density
Conditions can change comfort, physiology, and aerodynamic resistance.
Heat may raise strain and hydration demand. Cold, altitude, and air density can change performance in other ways.
Record: Temperature, humidity, altitude, and unusual weather.
Fatigue, fueling, and recovery
Speed may fall as a ride lengthens even on similar terrain.
Fitness, pacing, sleep, hydration, carbohydrate availability, illness, and accumulated training affect sustainable output.
Record: Ride duration, perceived effort, fueling, and recovery status.
Can indoor cycling speed be compared with road speed?
Stationary-bike speed is not directly comparable with outdoor speed unless the system uses a known, validated model and the same assumptions.
An indoor display may convert flywheel motion, resistance, cadence, or measured power into a virtual speed. It does not experience real wind, gradient, road surface, steering, braking, or traffic. Different machines can show different speeds for the same rider effort.
- For repeatability: compare sessions on the same bike, resistance mode, calibration, and software.
- For workload: record average power in watts when reliable, plus duration and cadence.
- For personal response: add perceived effort, talk test, and individualized heart-rate context.
- For virtual rides: retain the course, draft setting, rider mass, equipment model, and trainer calibration.
How to use cycling speed for training and progress
Average speed becomes more informative when repeated under similar conditions. It remains a route-specific outcome rather than a complete measure of training load.
- 1. Define the comparison. Use the same route or a matched distance, elevation profile, and surface.
- 2. Keep the time basis fixed. Compare moving with moving or elapsed with elapsed. Do not mix them.
- 3. Record conditions. Note wind, temperature, wet roads, traffic, group riding, and unusual stops.
- 4. Record the bicycle setup. Note bike, tires, pressure, luggage, assistance mode, and major mechanical changes.
- 5. Add workload context. Use power, heart rate, cadence, or perceived exertion when available and appropriate.
- 6. Compare trends. Review several similar rides instead of treating one personal best or one slow day as the full result.
Cycling speed and road safety
Never chase a chart speed when the route, visibility, traffic, surface, or your control requires slowing down.
The NHTSA bicycle-safety guidance recommends a properly fitted helmet, a bicycle that fits and works, visible clothing and equipment, front and rear lighting in low visibility, predictable riding, attention to hazards, and following applicable road rules.
- Before riding: check brakes, tires, steering, drivetrain, lights, load security, and helmet fit.
- While riding: preserve sight distance and room to stop; slow for corners, crossings, pedestrians, loose material, wet surfaces, and poor visibility.
- On public roads: follow local traffic, lighting, equipment, e-bike, path, and speed rules. They vary by jurisdiction.
- During exercise: stop and seek urgent medical help for chest pressure or pain, fainting, severe breathing difficulty, or another acute warning sign.
Frequently asked questions
What is a good average cycling speed?
There is no universal good speed. A useful benchmark compares the same rider on a similar route, bike, surface, weather pattern, stop definition, and effort. Ten mph on a technical trail can represent a different demand from 15 mph on a flat road.
How do I calculate average cycling speed?
Divide distance by time in matching units. Twenty miles in 1 hour 20 minutes equals 20 ÷ 1.3333, or 15 mph. Use moving time for a riding-only average and elapsed time for a door-to-door average.
What is the difference between moving speed and elapsed speed?
Moving average normally excludes time when the recording system identifies you as stopped. Elapsed average uses the entire period from start to finish. Auto-pause rules differ, so label the time basis when comparing rides.
How do I convert mph to km/h for cycling?
Multiply mph by 1.609344. For example, 15 mph × 1.609344 equals 24.14016 km/h, usually rounded to 24.1 km/h.
How do I convert km/h to mph?
Divide km/h by 1.609344. For example, 30 km/h ÷ 1.609344 equals about 18.64 mph.
Why is my cycling speed lower uphill or into a headwind?
Gradient raises the work needed against gravity, while a headwind raises apparent air speed and aerodynamic demand. At the same effort, either condition can lower road speed substantially.
Can I compare outdoor speed with stationary-bike speed?
Not reliably. An indoor bike derives display speed from its own flywheel, resistance, and software model. Compare power, cadence, resistance setting, duration, heart rate, or perceived effort on the same machine instead.
Does a higher cycling speed always mean a harder workout?
No. A tailwind, descent, drafting group, smoother surface, aerodynamic bike, or motor assistance can raise speed without a matching rise in personal effort. Power, heart rate, and perceived exertion add context.
Why does my GPS speed differ from a wheel sensor?
GPS estimates movement from satellite positions, while a wheel sensor uses wheel rotations and a circumference setting. Signal obstruction, sampling, smoothing, tire size, calibration, and auto-pause rules can create different averages.
How should e-bike speed be compared with pedal-bike speed?
Label the assistance mode and do not treat assisted speed as a direct measure of rider output. Local e-bike classes and speed rules vary, and motor support changes the relationship between road speed and human effort.
What cycling speed is safe?
A safe speed is one that lets the rider see hazards, maintain control, stop within the available space, follow local rules, and account for traffic, pedestrians, surface, visibility, weather, skill, and bicycle condition. A chart cannot set one safe number for every route.
Sources
National Institute of Standards and Technology — Unit Conversion and Exact Conversion-Factor Guidance
https://www.nist.gov/pml/owm/metric-si/unit-conversion
Compendium of Physical Activities — 2024 Adult Compendium — Bicycling MET Values
https://pacompendium.com/bicycling/
U.S. Department of Health and Human Services — Physical Activity Concepts — Absolute and Relative Intensity
https://odphp.health.gov/sites/default/files/2019-09/04_C_Background_and_Key_Physical_Activity_Concepts.pdf
National Highway Traffic Safety Administration — Bicycle Safety: Helmets, Visibility and Crash Prevention
https://www.nhtsa.gov/road-safety/bicycle-safety