Health & Medical · Exercise intensity reference
Heart Rate Zones Chart: Exercise Intensity by Age, HRmax and HRR
Compare the common five-zone model, age-based estimates, broad moderate and vigorous targets, heart-rate-reserve calculations, talk-test cues, device differences, and important safety limits.
Heart-rate zones are estimates, not medical clearance. Age formulas may miss an individual maximum, and medication, pregnancy, illness, heat, altitude, fitness, and health conditions can change the response. Stop exercise and call local emergency services for chest pain, fainting, severe shortness of breath, confusion, collapse, stroke symptoms, or a sustained dangerous-feeling rhythm. Read the ChartsLoom Disclaimer.
How are heart rate zones calculated?
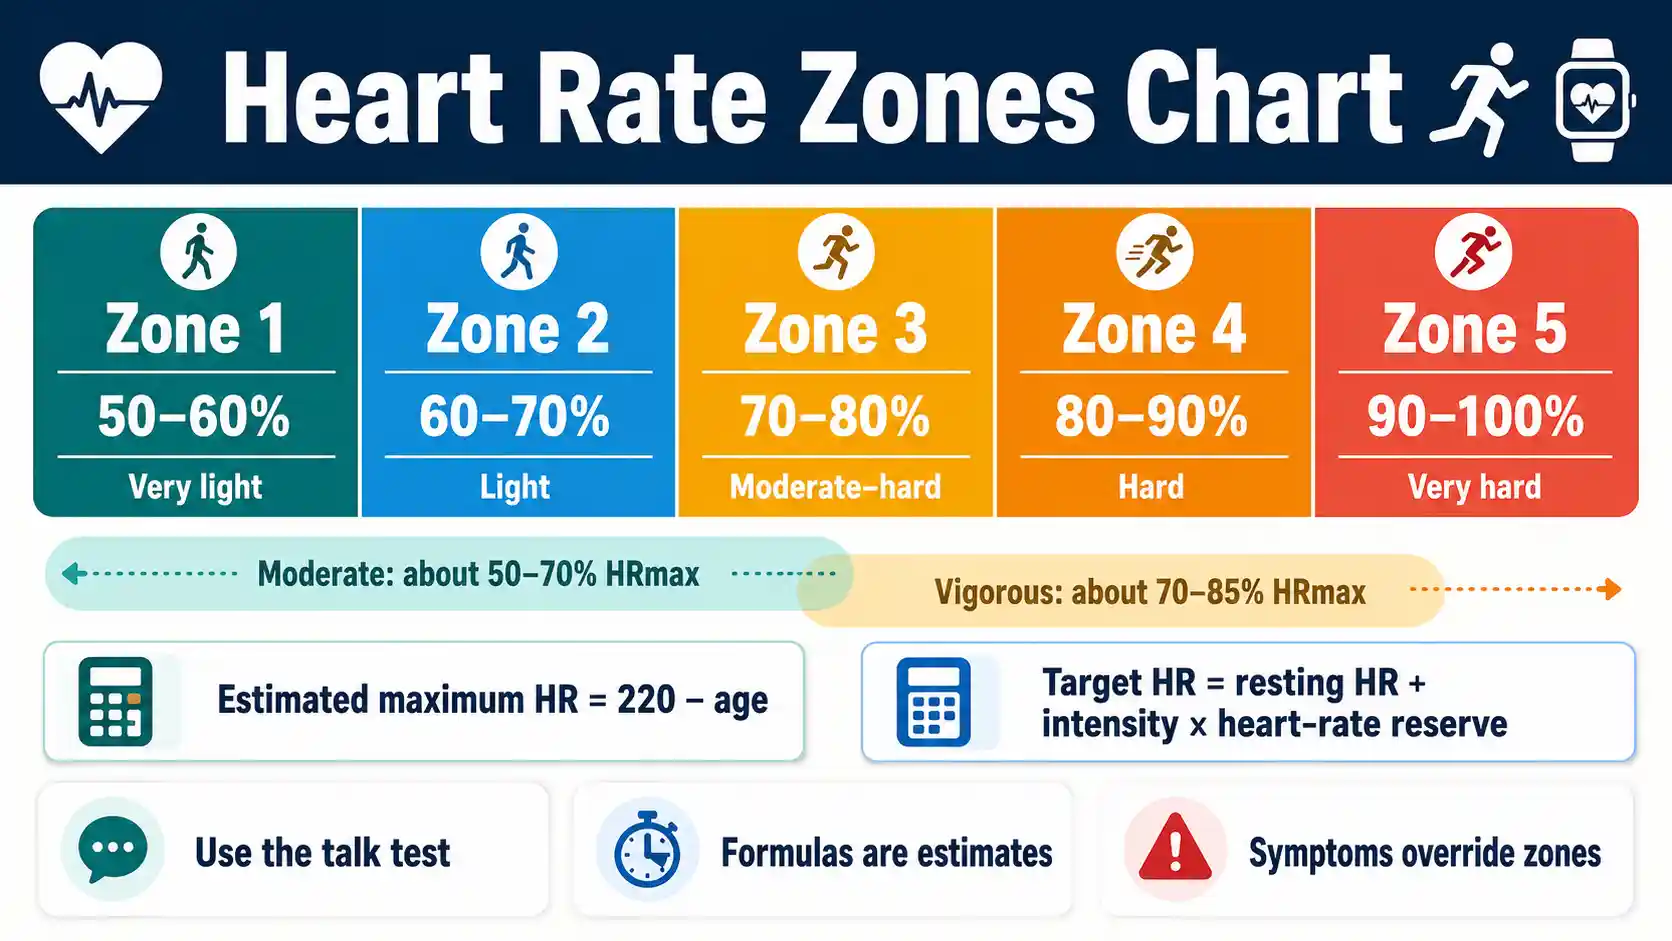
The simplest method estimates maximum heart rate, then multiplies it by an intensity percentage. A common five-zone model labels 50–60% as Zone 1, 60–70% as Zone 2, 70–80% as Zone 3, 80–90% as Zone 4, and 90–100% as Zone 5.
The American Heart Association uses 220 minus age as an average maximum-heart-rate estimate and describes moderate activity at about 50–70% of maximum and vigorous activity at about 70–85%. These broad bands overlap the five-zone convention but are not identical to it.
Common five-zone model
50–100% HRmax
Each zone spans 10 percentage points, but device labels can differ.
AHA moderate activity
About 50–70%
A broad percentage-of-maximum estimate for healthy adults.
Heart-rate reserve
Adds resting HR
Target = rest + intensity × (maximum − rest).
Safety rule
Symptoms override zones
Stop for chest pain, fainting, severe breathlessness, or a dangerous-feeling rhythm.
Five Heart Rate Zones Chart
This common coaching model divides 50–100% of estimated maximum heart rate into five equal bands. Zone names and boundaries vary among devices, coaches, laboratories, and clinical programs.
Swipe horizontally inside the table to view every column.
| Zone | Percent of estimated HRmax | Common description | Talk-test and effort context |
|---|---|---|---|
| Zone 1 | 50–60% | Very light / recovery | Easy conversation; gentle warm-up, cool-down, or easy movement |
| Zone 2 | 60–70% | Light / aerobic base | Comfortable conversation; breathing is deeper but controlled |
| Zone 3 | 70–80% | Moderate to hard | Talking becomes less comfortable; short sentences may still be possible |
| Zone 4 | 80–90% | Hard / threshold-oriented | Only short phrases; effort is difficult to sustain for long periods |
| Zone 5 | 90–100% | Very hard / near maximal | A few words at most; normally used for brief efforts by appropriately prepared people |
%HRmax = percentage of estimated or measured maximum heart rate.
- • The five-zone system is a training convention, not a universal medical standard.
- • The American Heart Association uses broader bands: about 50–70% of maximum for moderate activity and 70–85% for vigorous activity.
- • A measured maximum heart rate and ventilatory or lactate thresholds can personalize zones better than an age equation.
Download or export
Heart Rate Zones by Age Chart
Estimated values use 220 minus age. Individual maximum heart rate can differ substantially, so these figures are starting points rather than guaranteed limits.
Swipe horizontally inside the table to view every column.
| Age | Estimated HRmax | 50–60% | 60–70% | 70–80% | 80–90% | 90–100% |
|---|---|---|---|---|---|---|
| 20 | 200 bpm | 100–120 | 120–140 | 140–160 | 160–180 | 180–200 |
| 25 | 195 bpm | 98–117 | 117–137 | 137–156 | 156–176 | 176–195 |
| 30 | 190 bpm | 95–114 | 114–133 | 133–152 | 152–171 | 171–190 |
| 35 | 185 bpm | 93–111 | 111–130 | 130–148 | 148–167 | 167–185 |
| 40 | 180 bpm | 90–108 | 108–126 | 126–144 | 144–162 | 162–180 |
| 45 | 175 bpm | 88–105 | 105–123 | 123–140 | 140–158 | 158–175 |
| 50 | 170 bpm | 85–102 | 102–119 | 119–136 | 136–153 | 153–170 |
| 55 | 165 bpm | 83–99 | 99–116 | 116–132 | 132–149 | 149–165 |
| 60 | 160 bpm | 80–96 | 96–112 | 112–128 | 128–144 | 144–160 |
| 65 | 155 bpm | 78–93 | 93–109 | 109–124 | 124–140 | 140–155 |
| 70 | 150 bpm | 75–90 | 90–105 | 105–120 | 120–135 | 135–150 |
| 75 | 145 bpm | 73–87 | 87–102 | 102–116 | 116–131 | 131–145 |
| 80 | 140 bpm | 70–84 | 84–98 | 98–112 | 112–126 | 126–140 |
All values are rounded to the nearest whole beat per minute.
- • AHA describes 220 minus age as an average estimate, not a measured maximum.
- • The upper rows are not intended for children or adolescents; pediatric exercise assessment requires age-appropriate guidance.
- • Medication, fitness, heat, dehydration, altitude, illness, and health conditions can change the observed response.
Download or export
Percentage is only the starting point
Five-zone labels do not create five universal physiological boundaries
The common model divides 50–100% of maximum heart rate into equal bands. Real ventilatory and lactate thresholds do not necessarily land exactly at 60%, 70%, 80%, or 90%.
AHA broad bands
Moderate: about 50–70% HRmax. Vigorous: about 70–85% HRmax.
Relative effort
CDC: moderate is about 5–6 out of 10; vigorous begins around 7–8.
Browser-only educational tool
Heart Rate Zone Calculator
Estimate common five-zone bands, the American Heart Association’s broad moderate and vigorous ranges, and a heart-rate-reserve comparison. No information is stored.
Estimated maximum
180 bpm
Heart-rate reserve: 120 bpm
| Zone | %HRmax | Estimated bpm | Same % applied to HRR |
|---|---|---|---|
| Zone 1Very light / recovery | 50–60% | 90–108 bpm | 120–132 bpm |
| Zone 2Light / aerobic base | 60–70% | 108–126 bpm | 132–144 bpm |
| Zone 3Moderate to hard | 70–80% | 126–144 bpm | 144–156 bpm |
| Zone 4Hard | 80–90% | 144–162 bpm | 156–168 bpm |
| Zone 5Very hard / near maximal | 90–100% | 162–180 bpm | 168–180 bpm |
AHA moderate
90–126 bpm
50–70% HRmax
AHA vigorous
126–153 bpm
70–85% HRmax
40–59% HRR
108–131 bpm
Example exercise-science moderate band
Do not mix methods silently. A percentage of HRmax and the same percentage of HRR produce different bpm values. Devices may use either method or custom thresholds.
Limitations: Age equations can miss an individual maximum by a meaningful amount. Medication, heat, illness, altitude, pregnancy, fitness, and sensor error can change the observed rate. This result is not medical clearance.
Moderate and Vigorous Heart Rate Intensity Chart
Different organizations and methods group intensity differently. Use the labels attached to the specific method rather than mixing percentages across systems.
Swipe horizontally inside the table to view every column.
| Method | Moderate intensity | Vigorous intensity | How to interpret |
|---|---|---|---|
| American Heart Association, %HRmax | About 50–70% HRmax | About 70–85% HRmax | Simple public-facing estimate based on maximum heart rate |
| CDC talk test | Can talk but not sing | Can say only a few words before pausing | Relative intensity based on breathing and conversation |
| CDC 0–10 effort scale | About 5–6 out of 10 | About 7–8 out of 10 | Compares the activity with the individual person’s maximum effort |
| Mayo Clinic, %HRmax | About 50–70% HRmax | About 70–85% HRmax | Best used with symptoms and perceived exertion |
| Heart-rate reserve method | Often prescribed with lower percentages than %HRmax | Depends on program and clinical context | Adds resting heart rate and should not reuse %HRmax cutoffs without checking the source |
- • Percent of maximum heart rate and percent of heart-rate reserve are different scales.
- • The talk test remains useful when wrist sensors are inaccurate or medication changes the rate response.
- • A clinician or exercise professional may prescribe different limits after testing.
Download or export
Use the talk test when the number and the effort disagree
CDC describes moderate relative intensity as about 5–6 out of 10 and vigorous intensity as about 7–8. Moderate activity generally allows talking but not singing; vigorous activity generally allows only a few words before a breath.
Maximum Heart Rate Formula Comparison
Age equations estimate population averages. They can be useful for planning, but they cannot know an individual person’s true maximum.
Swipe horizontally inside the table to view every column.
| Method | Formula or input | Strength | Important limitation |
|---|---|---|---|
| AHA simple estimate | 220 − age | Easy to calculate and widely recognized | Individual error can be large; not a measured ceiling |
| Tanaka research equation | 208 − (0.7 × age) | Derived from a large analysis of healthy adults | Still an estimate and not validated equally for every population |
| Measured HRmax | Highest value reached during an appropriate maximal test | More individualized than an age equation | Testing must be suitable and may require clinical supervision |
| Recent verified personal maximum | Highest credible value from hard exercise or testing | Can improve device-zone settings when the value is reliable | A sensor spike, illness, medication change, or incomplete effort can mislead |
| Clinician-prescribed limit | Personal threshold or ceiling | Accounts for disease, medication, procedures, or rehabilitation goals | Should override generic app or chart settings |
- • Do not attempt a maximal-effort test solely to discover a number when you have symptoms, known disease, or no appropriate testing plan.
- • If two formulas give different results, the disagreement demonstrates the uncertainty rather than identifying a correct personal maximum.
- • Consumer devices may allow a custom maximum-heart-rate setting.
Download or export
Why maximum-heart-rate formulas disagree
Age explains part of the population trend, but it does not predict every individual. The Tanaka analysis proposed 208 − 0.7 × age for healthy adults. A formula difference should be treated as uncertainty, not as proof that one exact ceiling is safe.
Heart Rate Reserve Zone Calculation Chart
Heart-rate reserve, often called the Karvonen method, incorporates resting heart rate: target = resting HR + intensity × (maximum HR − resting HR).
Swipe horizontally inside the table to view every column.
| Step | Calculation | Example: age 40, resting HR 60 | Interpretation |
|---|---|---|---|
| 1. Estimate maximum | 220 − age | 220 − 40 = 180 bpm | A starting estimate, not a measured maximum |
| 2. Calculate reserve | HRmax − resting HR | 180 − 60 = 120 bpm HRR | The span between rest and estimated maximum |
| 3. Select intensity | Choose a method-specific HRR percentage | Example: 50% HRR | Do not automatically reuse five-zone %HRmax cutoffs |
| 4. Calculate target | Resting HR + percentage × HRR | 60 + (0.50 × 120) = 120 bpm | Estimated exercise rate at the selected reserve percentage |
| 5. Create a range | Calculate lower and upper percentages separately | 40–59% HRR = 108–131 bpm | One possible moderate-intensity prescription used in exercise science |
| 6. Verify by effort | Compare with talk test, RPE, symptoms, and workload | Conversation and breathing should match the intended effort | Disagreement may signal inaccurate inputs or individual variation |
- • Resting heart rate should be measured under consistent calm conditions, not copied from a single stressed or post-activity reading.
- • Heart-rate reserve can shift as resting or maximum heart rate changes.
- • Use clinician-set ranges for cardiac rehabilitation, pregnancy complications, arrhythmias, or rate-limiting medication.
Download or export
Heart Rate Zones, Talk Test and Perceived Effort
Breathing, conversation, technique, duration, and symptoms help verify whether a calculated zone resembles the real effort.
Swipe horizontally inside the table to view every column.
| Training band | Conversation | 0–10 effort guide | Typical session context |
|---|---|---|---|
| Below 50% HRmax | Easy conversation | About 1–2 | Very easy movement, preparation, or recovery |
| Zone 1, 50–60% | Full conversation | About 2–3 | Warm-up, cool-down, easy recovery work |
| Zone 2, 60–70% | Comfortable sentences | About 3–4 | Steady easy aerobic work for many people |
| Zone 3, 70–80% | Shorter sentences | About 5–6 | Moderate to hard sustained effort |
| Zone 4, 80–90% | Short phrases | About 7–8 | Hard intervals or threshold-oriented work |
| Zone 5, 90–100% | A few words or none | About 9–10 | Brief near-maximal efforts with substantial recovery |
- • RPE labels are approximate because perceived exertion depends on fitness, environment, sleep, pain, and experience.
- • CDC defines moderate relative intensity around 5–6 and vigorous intensity beginning around 7–8 on its 0–10 scale.
- • Stop when symptoms are abnormal for you, even if the monitor still shows the planned zone.
Download or export
Why Zone 2 is not the same number everywhere
Cleveland Clinic describes the common five-zone convention, but watches and training systems may instead use heart-rate reserve, ventilatory threshold, lactate threshold, a measured maximum, or custom values. Before comparing two charts, identify the method behind each percentage.
Heart Rate Zone Limitations and Special Contexts
A formula can be mathematically correct while the result is physiologically inappropriate for a particular person or session.
Swipe horizontally inside the table to view every column.
| Factor | How it changes zone use | Better approach | Do not do this |
|---|---|---|---|
| Beta blocker or other rate-limiting medicine | Exercise heart rate may stay below age-predicted targets | Use clinician guidance, talk test, workload, and perceived effort | Do not skip or change medication to reach a zone |
| Known heart, lung, vascular, or metabolic disease | Safe intensity may differ from population charts | Use an individualized prescription or supervised rehabilitation when advised | Do not treat 85% of estimated maximum as automatic clearance |
| Pregnancy | Heart rate and perceived effort change with gestation and fitness | Use obstetric guidance and moderate-intensity cues | Do not chase a universal pregnancy heart-rate ceiling |
| Heat and humidity | Rate may drift upward at the same pace | Reduce workload, cool down, hydrate appropriately, and monitor symptoms | Do not maintain pace solely to stay in a zone |
| Dehydration or illness | Rate can be unusually high and effort tolerance lower | Rest, address illness, and return gradually when appropriate | Do not use the workout to test whether you are recovered |
| Altitude | Heart rate and breathing may rise at familiar workloads | Allow acclimatization and lower intensity initially | Do not assume sea-level zones feel identical |
| Wrist optical sensor | Motion, fit, cadence lock, skin contact, and temperature can distort readings | Improve fit or verify with manual pulse or chest strap | Do not react to one implausible spike without checking |
| Short intervals or sprints | Heart rate lags behind rapidly changing workload | Use pace, power, RPE, or coach-prescribed intervals | Do not extend an interval merely because heart rate has not caught up |
| Highly trained endurance athlete | Generic zones may not align with ventilatory or lactate thresholds | Use measured thresholds and sport-specific testing when useful | Do not assume every athlete has the same Zone 2 boundary |
- • Symptoms and clinician-set instructions take priority over a generic zone.
- • Beta blockers commonly lower exercise heart rate; the American Heart Association recommends discussing how to monitor intensity.
- • A chest strap often follows rapid changes better than a wrist optical sensor, but no consumer sensor is infallible.
Download or export
Medication can make age-predicted zones misleading
The American Heart Association explains that beta blockers slow the heart-rate response to exercise. Do not skip or change prescribed medicine to make a watch display a target number; use the monitoring approach agreed with the prescriber.
Exercise Heart Rate Warning Signs and Next Steps
The correct response depends on symptoms and stability, not whether the displayed number sits inside or outside a colored zone.
Swipe horizontally inside the table to view every column.
| Situation | Action | Urgency | Why |
|---|---|---|---|
| Chest pain, pressure, fainting, severe breathlessness, confusion, collapse, or stroke symptoms during exercise | Stop and call local emergency services | Emergency | These can signal a dangerous cardiovascular or neurologic event |
| Sustained rapid or irregular rhythm with dizziness, weakness, or near-fainting | Stop, sit or lie safely, and obtain urgent assessment | Urgent or emergency | An arrhythmia or reduced blood flow may be present |
| Heart rate far above expected with heat illness signs | Stop, move to a cool place, and seek urgent help for confusion, collapse, or severe symptoms | Urgent | Heat illness can progress quickly |
| Rate is unexpectedly high but there are no severe symptoms | Reduce intensity, recover, check sensor fit, hydration, illness, and recent stimulants | Pause and reassess | The cause may be workload, environment, physiology, or measurement error |
| Rate is unexpectedly low during hard work, especially on medication | Reduce effort and discuss repeated findings with a clinician | Clinical review | Rate-limiting medication or conduction problems can blunt response |
| Monitor shows a brief impossible spike or drop but effort feels unchanged | Verify with another method before changing the session | Usually verify | Optical sensors can produce artifacts |
| New exercise intolerance, unusual fatigue, or declining performance over several sessions | Arrange medical review before hard training | Prompt review | Illness, anemia, medication effects, overreaching, or cardiovascular problems may contribute |
| Normal recovery and no concerning symptoms | Cool down gradually and record useful trends | Routine | Recovery patterns are best compared under similar conditions |
- • Never delay emergency care to repeat a heart-rate reading or wait for a wearable alert to clear.
- • Do not drive yourself when faint, severely short of breath, confused, or otherwise unstable.
- • Local emergency numbers and service names vary by country.
Download or export
Frequently asked questions
What are the five heart rate zones?
A common five-zone model divides 50 to 100 percent of maximum heart rate into Zone 1 at 50–60%, Zone 2 at 60–70%, Zone 3 at 70–80%, Zone 4 at 80–90%, and Zone 5 at 90–100%. The labels and boundaries are conventions and vary among devices and programs.
How do I estimate maximum heart rate?
The American Heart Association commonly uses 220 minus age as a simple estimate. The research-based Tanaka equation is 208 minus 0.7 times age. Both describe population averages and can differ from a person’s measured maximum.
What is the target heart rate for moderate exercise?
The American Heart Association describes moderate activity as about 50 to 70 percent of maximum heart rate. The CDC talk test describes moderate intensity as being able to talk but not sing.
What is the target heart rate for vigorous exercise?
The American Heart Association describes vigorous activity as about 70 to 85 percent of maximum heart rate. The CDC says vigorous activity usually allows only a few words before pausing for breath.
Is Zone 2 always 60 to 70 percent of maximum heart rate?
It is 60 to 70 percent in the common five-zone maximum-heart-rate convention. Laboratory, threshold-based, heart-rate-reserve, and device-specific systems may define Zone 2 differently.
What is heart-rate reserve?
Heart-rate reserve is maximum heart rate minus resting heart rate. The Karvonen-style target calculation adds a chosen percentage of that reserve back to the resting heart rate.
Is heart-rate reserve more accurate than percent maximum heart rate?
Heart-rate reserve includes resting heart rate and may better reflect individual fitness than a simple percent of estimated maximum. It still depends on accurate resting and maximum inputs and is not a substitute for measured thresholds or medical guidance.
Why does my watch show different zones from this chart?
The device may use a different maximum-heart-rate estimate, heart-rate reserve, a measured value, threshold testing, or custom boundaries. Review the device settings before comparing the labels.
Can beta blockers make heart rate zones inaccurate?
Yes. Beta blockers and some other medicines blunt the increase in heart rate during exercise. Use clinician guidance and measures such as the talk test or perceived exertion rather than changing medication to reach a generic target.
Should beginners train in Zone 5?
Near-maximal exercise is demanding and is not required for basic health benefits. Beginners generally build frequency and duration at easier intensities before adding hard intervals, and people with symptoms or medical conditions should seek appropriate guidance.
Can I use heart rate zones for walking?
Yes, when walking raises heart rate enough to match the intended relative effort. The talk test may be more practical: moderate walking usually allows conversation but not singing.
Why does heart rate rise in heat at the same pace?
Heat increases cardiovascular strain and can cause heart-rate drift even when pace stays constant. Reduce workload, use symptoms and perceived effort, and do not force the same pace merely to preserve a zone.
Are wrist heart-rate monitors accurate?
They can be useful for trends, but motion, fit, cadence lock, cold skin, sweat, and contact can create errors. Verify implausible values with another method and do not ignore symptoms because a wearable looks reassuring.
What symptoms mean I should stop exercising?
Stop for chest pain or pressure, fainting, severe or unusual shortness of breath, confusion, collapse, neurologic symptoms, or a sustained dangerous-feeling rhythm. Call local emergency services for severe or unstable symptoms.
Do heart rate zones provide medical clearance for exercise?
No. They are educational intensity estimates. They cannot assess coronary disease, arrhythmia risk, blood pressure response, medication effects, pregnancy complications, or whether maximal exercise is safe for a particular person.
Sources
These sources support the visible tables, formulas, interpretation notes, and safety guidance. URLs are shown as plain text for transparent reference.
American Heart Association — Target Heart Rates Chart
Provides the 220-minus-age estimate and broad target ranges of about 50–70% of maximum for moderate activity and 70–85% for vigorous activity.
https://www.heart.org/en/healthy-living/exercise-and-physical-activity/fitness-basics/target-heart-rates
Centers for Disease Control and Prevention — How to Measure Physical Activity Intensity
Explains relative intensity, the talk test, and a 0–10 perceived-effort scale.
https://www.cdc.gov/physical-activity-basics/measuring/index.html
Cleveland Clinic — What Are the Five Heart Rate Zones?
Describes the common five-zone convention based on 50–100% of estimated maximum heart rate.
https://health.clevelandclinic.org/exercise-heart-rate-zones-explained
Mayo Clinic — Exercise Intensity: How to Measure It
Compares maximum-heart-rate and heart-rate-reserve calculations and discusses medication and perceived-exertion limitations.
https://www.mayoclinic.org/healthy-lifestyle/fitness/in-depth/exercise-intensity/art-20046887
American College of Sports Medicine — Exercising Your Way to Lowering Your Blood Pressure
Defines moderate exercise for its hypertension guidance as 40–59% of heart-rate reserve, shows the reserve calculation, and emphasizes perceived exertion when medication alters heart rate.
https://acsm.org/wp-content/uploads/2025/02/Exercising-Your-Way-to-Lowering-Your-Blood-Pressure-handout.pdf
PubMed, U.S. National Library of Medicine — Age-Predicted Maximal Heart Rate Revisited
Reports the research-derived equation 208 minus 0.7 times age for estimating maximum heart rate in healthy adults.
https://pubmed.ncbi.nlm.nih.gov/11153730/
American Heart Association — How Do Beta Blocker Drugs Affect Exercise?
Explains that beta blockers can blunt the exercise heart-rate response and that perceived effort or clinician guidance may be more useful.
https://www.heart.org/en/health-topics/consumer-healthcare/medication-information/how-do-beta-blocker-drugs-affect-exercise
American Heart Association — Recommendations for Physical Activity in Adults
Summarizes weekly moderate- and vigorous-intensity aerobic activity recommendations.
https://www.heart.org/en/healthy-living/exercise-and-physical-activity/fitness-basics/aha-recs-for-physical-activity-in-adults
American Heart Association — All About Heart Rate
Defines pulse and heart rate, discusses factors that affect readings, and identifies symptoms requiring urgent care.
https://www.heart.org/en/health-topics/high-blood-pressure/the-facts-about-high-blood-pressure/all-about-heart-rate-pulse
Every table includes notes, source attribution, and controls for copying, CSV, PNG, PDF, and printing.