Science & Chemistry
Electronegativity Chart
Compare Pauling electronegativity values, see how the periodic trend changes across rows and down groups, calculate bond electronegativity differences, and distinguish electronegativity from electron affinity, ionization energy, and atomic radius.
Electronegativity is not one uniquely measured physical constant. Several definitions and scales exist, so numerical comparisons are meaningful only when the same scale is used consistently.
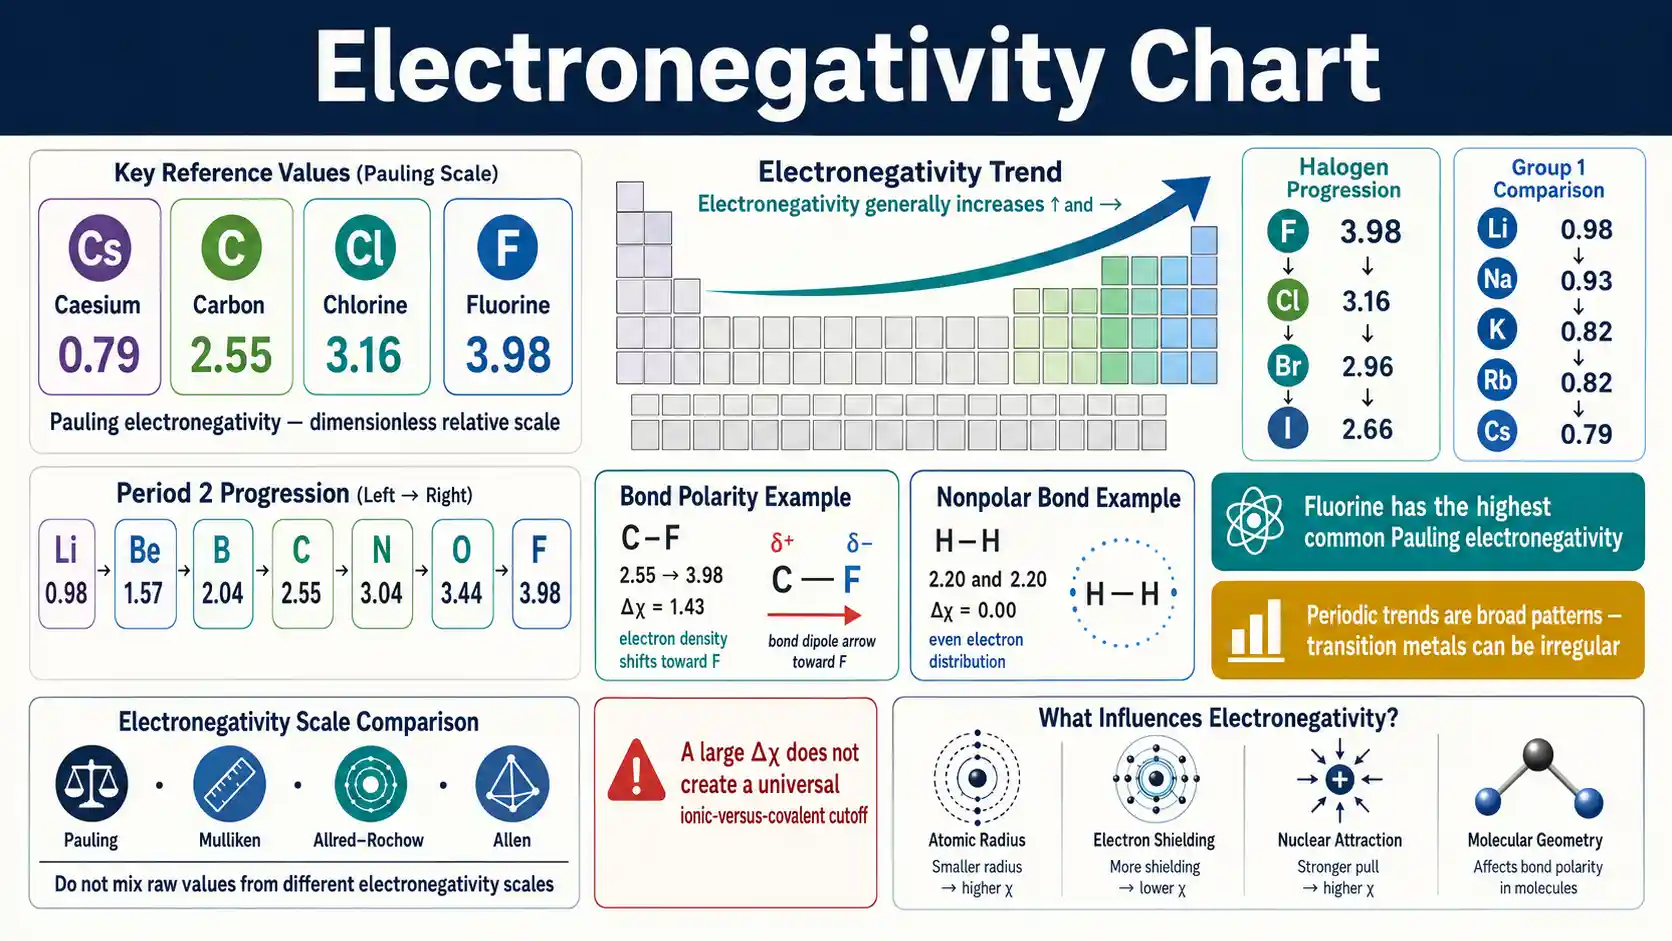
How electronegativity works
Electronegativity describes an atom's tendency to attract bonding electrons. IUPAC notes that several definitions exist; the Pauling scale remains the most familiar relative scale in general chemistry. See the IUPAC definition.
Fluorine is the most electronegative element on the common Pauling scale at 3.98. Oxygen is 3.44, chlorine is 3.16, nitrogen is 3.04, and carbon is 2.55. The Royal Society of Chemistry lists fluorine at 3.98 in its element data. See the fluorine reference.
Meaning
Attraction for bonding electrons
Electronegativity compares how strongly atoms draw shared electron density toward themselves in a chemical environment.
Periodic direction
Generally up and right
Main-group electronegativity usually increases across a period and decreases down a group.
Highest common value
Fluorine = 3.98
Fluorine has the highest common Pauling electronegativity used in general-chemistry tables.
Important limitation
State the scale
Pauling, Mulliken, Allen, and Allred–Rochow electronegativities are defined differently and should not be mixed.
Across a main-group period, electronegativity generally increases because effective nuclear attraction rises while valence electrons remain in the same principal shell. Down a group, added shells increase size and shielding, so attraction for shared electrons generally weakens.
Electronegativity Chart — Selected Pauling Values
Representative Pauling electronegativities for commonly used elements. Values are dimensionless relative numbers on the Pauling scale.
Swipe horizontally inside the table to view every column.
| Element | Symbol | Atomic number | Pauling electronegativity | Quick context |
|---|---|---|---|---|
| Hydrogen | H | 1 | 2.20 | Reference nonmetal |
| Lithium | Li | 3 | 0.98 | Low-electronegativity alkali metal |
| Beryllium | Be | 4 | 1.57 | Higher than Li across period 2 |
| Boron | B | 5 | 2.04 | Metalloid region |
| Carbon | C | 6 | 2.55 | Common covalent-bond reference |
| Nitrogen | N | 7 | 3.04 | Strong electron attraction in bonds |
| Oxygen | O | 8 | 3.44 | Highly electronegative nonmetal |
| Fluorine | F | 9 | 3.98 — Highest common Pauling value | Highest common Pauling value |
| Sodium | Na | 11 | 0.93 | Low-electronegativity alkali metal |
| Magnesium | Mg | 12 | 1.31 | Higher than Na across period 3 |
| Aluminium | Al | 13 | 1.61 | Metal with moderate Pauling value |
| Silicon | Si | 14 | 1.90 | Metalloid region |
| Phosphorus | P | 15 | 2.19 | Nonmetal |
| Sulfur | S | 16 | 2.58 | Higher than phosphorus |
| Chlorine | Cl | 17 | 3.16 | Highly electronegative halogen |
| Potassium | K | 19 | 0.82 | Very low Pauling value |
| Calcium | Ca | 20 | 1.00 | Alkaline-earth metal |
| Scandium | Sc | 21 | 1.36 | Transition metal |
| Titanium | Ti | 22 | 1.54 | Transition metal |
| Vanadium | V | 23 | 1.63 | Transition metal |
| Chromium | Cr | 24 | 1.66 | Transition metal |
| Manganese | Mn | 25 | 1.55 | Trend is not perfectly monotonic |
| Iron | Fe | 26 | 1.83 | Transition metal |
| Cobalt | Co | 27 | 1.88 | Transition metal |
| Nickel | Ni | 28 | 1.91 | Transition metal |
| Copper | Cu | 29 | 1.90 | Transition metal |
| Zinc | Zn | 30 | 1.65 | Transition-metal-block element |
| Gallium | Ga | 31 | 1.81 | Post-transition metal |
| Germanium | Ge | 32 | 2.01 | Metalloid |
| Arsenic | As | 33 | 2.18 | Metalloid/nonmetal boundary |
| Selenium | Se | 34 | 2.55 | Nonmetal |
| Bromine | Br | 35 | 2.96 | Halogen |
| Rubidium | Rb | 37 | 0.82 | Alkali metal |
| Strontium | Sr | 38 | 0.95 | Alkaline-earth metal |
| Silver | Ag | 47 | 1.93 | Transition metal |
| Cadmium | Cd | 48 | 1.69 | Group 12 metal |
| Tin | Sn | 50 | 1.96 | Post-transition metal |
| Antimony | Sb | 51 | 2.05 | Metalloid |
| Tellurium | Te | 52 | 2.10 | Metalloid/nonmetal region |
| Iodine | I | 53 | 2.66 | Halogen |
| Caesium | Cs | 55 | 0.79 — Very low Pauling value | One of the lowest common Pauling values |
| Gold | Au | 79 | 2.54 | High value for a metal |
Pauling electronegativity is a dimensionless relative scale.
- • This table uses Pauling values; other electronegativity scales can assign different numerical values and even slightly different rankings.
- • A missing value on some periodic tables does not mean the element has no chemistry; it can reflect how that scale is defined or the data available for it.
Download or export
Period 2 Electronegativity Trend
Pauling electronegativity rises strongly from lithium toward fluorine across period 2.
Swipe horizontally inside the table to view every column.
| Element | Li | Be | B | C | N | O | F |
|---|---|---|---|---|---|---|---|
| Pauling value | 0.98 | 1.57 | 2.04 | 2.55 | 3.04 | 3.44 | 3.98 |
Direction: generally increases left → right.
- • The increase reflects stronger effective nuclear attraction across the period as valence electrons occupy the same principal shell.
- • Noble gases are omitted because standard Pauling tables do not consistently assign values to every noble gas.
Download or export
Period 3 Electronegativity Trend
The main-group sequence from sodium to chlorine shows the familiar left-to-right increase.
Swipe horizontally inside the table to view every column.
| Element | Na | Mg | Al | Si | P | S | Cl |
|---|---|---|---|---|---|---|---|
| Pauling value | 0.93 | 1.31 | 1.61 | 1.90 | 2.19 | 2.58 | 3.16 |
Direction: generally increases left → right.
- • The trend is most useful as a broad main-group pattern, not a rule that every neighboring pair in the whole periodic table must increase smoothly.
Download or export
Group 1 Electronegativity Trend
Alkali-metal Pauling electronegativities are low and generally decrease down the group.
Swipe horizontally inside the table to view every column.
| Element | Li | Na | K | Rb | Cs |
|---|---|---|---|---|---|
| Pauling value | 0.98 | 0.93 | 0.82 | 0.82 | 0.79 |
Direction: generally decreases down group 1.
- • Larger atomic size and greater shielding reduce the nucleus ability to attract shared bonding electrons at longer distance.
Download or export
Halogen Electronegativity Trend
Halogens have high Pauling values, with fluorine highest and values falling down the group.
Swipe horizontally inside the table to view every column.
| Element | F | Cl | Br | I |
|---|---|---|---|---|
| Pauling value | 3.98 — Fluorine highest | 3.16 | 2.96 | 2.66 |
Direction: decreases down group 17.
- • Fluorine has the highest common Pauling electronegativity at 3.98.
Download or export
Fluorine sits at the high end; caesium sits near the low end
Fluorine's Pauling value is 3.98, while caesium is 0.79. That contrast captures the broad periodic trend: small upper-right nonmetals attract bonding electron density strongly, while large lower-left metals generally do so weakly. The RSC lists caesium at 0.79. See the caesium reference.
Electronegativity Difference Finder
Choose two elements to compare their Pauling values. The tool calculates Δχ and identifies which atom attracts bonding electrons more strongly on this scale.
Δχ = 1.43
Fluorine is more electronegative, so the bond electron density is expected to shift toward F.
Δχ is a polarity guide, not a universal ionic-versus-covalent cutoff. Molecular polarity also depends on geometry, and values from different electronegativity scales should not be mixed.
Electronegativity Difference Examples
Electronegativity difference helps compare bond polarity, but it does not create universal cutoffs that determine bond type by itself.
Swipe horizontally inside the table to view every column.
| Bond | Values used | Δχ | What Δχ suggests | Important context |
|---|---|---|---|---|
| H–H | 2.20 and 2.20 | 0.00 | No electronegativity-driven bond dipole | Identical atoms |
| C–H | 2.55 and 2.20 | 0.35 | Small bond polarity | Often treated as weakly polar in introductory chemistry |
| H–Cl | 2.20 and 3.16 | 0.96 | Clear bond polarity toward Cl | Molecular polarity also depends on geometry |
| O–H | 3.44 and 2.20 | 1.24 | Strong bond polarity toward O | Important in water and alcohols |
| C–F | 2.55 and 3.98 | 1.43 | Strong bond polarity toward F | Still a covalent bond in many molecules |
| Na–Cl | 0.93 and 3.16 | 2.23 | Very large difference | Consistent with strongly ionic bonding in NaCl solid |
Δχ = |χA − χB| on the same electronegativity scale.
- • Do not mix Pauling and other scale values in one subtraction.
- • Bonding is a continuum; electronegativity difference is one descriptor, not a universal binary classifier.
Download or export
A larger Δχ usually means a more polarized bond
For H–Cl, the Pauling difference is |3.16 − 2.20| = 0.96, so electron density shifts toward chlorine. For C–F, Δχ is 1.43 and the bond is strongly polarized toward fluorine. These differences help compare polarity, but a single numeric cutoff does not universally decide whether a bond is ionic or covalent.
Electronegativity Scale Comparison
Electronegativity is a concept with multiple definitions. Numerical values only make sense when the scale is stated.
Swipe horizontally inside the table to view every column.
| Scale | Basis | Typical use | Key limitation |
|---|---|---|---|
| Pauling | Relative bond-energy relationships | General chemistry, bond polarity, periodic comparisons | Relative scale; depends on bond-energy framework |
| Mulliken | Average of ionization energy and electron affinity | Connects electronegativity to atomic energy data | Numerical scale differs from Pauling unless transformed |
| Allred–Rochow | Effective nuclear charge and covalent radius | Atomic-property interpretation | Requires model-dependent effective charge and radius |
| Allen | Average valence-electron energy | Atomic spectroscopy-oriented comparisons | Values and ranking can differ from Pauling |
Never compare raw numbers from different scales as though they were the same unit system.
- • IUPAC explicitly notes that several definitions of electronegativity exist.
- • This page uses Pauling values for the main numerical chart.
Download or export
Why Electronegativity Changes Across the Periodic Table
Electronegativity trends emerge from competing atomic-size, shielding, and nuclear-attraction effects.
Swipe horizontally inside the table to view every column.
| Factor | Across a period | Down a group | Effect on electronegativity |
|---|---|---|---|
| Effective nuclear attraction | Generally increases | Nuclear charge increases but shielding also grows | Stronger attraction tends to raise electronegativity |
| Atomic size | Generally decreases | Generally increases | Shorter bonding distance tends to strengthen attraction for shared electrons |
| Electron shielding | Changes modestly within a shell | Increases as shells are added | More shielding tends to lower attraction felt by valence electrons |
| Subshell structure | Can create irregularities | Changes with block and shell | Explains why detailed trends are not perfectly smooth |
| Oxidation / bonding environment | Not captured by one isolated-atom trend | Not captured by one isolated-atom trend | Actual electron distribution in compounds depends on chemical environment |
Periodic trends are qualitative patterns, not exception-free equations.
- • Use the trend arrow for first-pass comparisons, then consult numerical values for close or transition-metal cases.
Download or export
Electronegativity is not electron affinity
Electron affinity is an energy change associated with adding an electron to an isolated atom. Electronegativity is a comparative attraction for electrons in a bonding context. They are related concepts, and Mulliken electronegativity explicitly uses ionization energy and electron affinity, but they are not the same quantity.
Common Electronegativity Mistakes
Most errors come from treating a useful trend or heuristic as an exact physical law.
Swipe horizontally inside the table to view every column.
| Mistake | Why it fails | Better approach |
|---|---|---|
| Calling electronegativity an energy with SI units | Pauling values are relative and dimensionless | State the scale and keep its numbers on that scale |
| Assuming every value increases smoothly left to right | Transition-metal and heavy-element trends contain irregularities | Use the broad trend, then verify close values |
| Mixing scales in one comparison | Pauling, Mulliken, Allen, and Allred–Rochow are defined differently | Use one scale consistently |
| Using Δχ as an absolute ionic/covalent cutoff | Bonding is continuous and environment-dependent | Treat Δχ as a polarity guide, not a universal classifier |
| Calling electronegativity the same as electron affinity | Electron affinity is an energy change for an isolated atom | Keep the concepts separate |
| Saying the more electronegative atom becomes fully negative in every bond | Many bonds only develop partial charges | Use δ− and δ+ unless full ionic assignment is justified |
| Ignoring molecular geometry | Polar bonds can cancel in a symmetric molecule | Evaluate bond dipoles and geometry for molecular polarity |
| Assuming a blank noble-gas cell means “zero” | Some scales do not assign a conventional value | Treat blank as not assigned on that scale, not zero |
Use electronegativity as a comparative bonding concept.
- • The most reliable interpretation states the scale, the elements compared, and the chemical question being answered.
Download or export
Bond polarity and molecular polarity are different questions
Electronegativity difference predicts the direction and relative strength of individual bond dipoles. Molecular polarity then depends on how those bond dipoles combine in three-dimensional geometry. Carbon dioxide has polar C=O bonds, but its linear symmetry causes the bond dipoles to cancel in the overall molecule.
A blank electronegativity cell should not be read as zero. Some scales cannot or do not assign conventional values to every element, especially noble gases. State the scale and preserve blank or unavailable entries instead of inventing a numeric zero.
Frequently asked questions
What is electronegativity?
Electronegativity is the tendency of an atom in a chemical environment to attract bonding electrons toward itself. The Pauling scale expresses this tendency as relative, dimensionless values.
What is the most electronegative element?
Fluorine is the most electronegative element on the common Pauling scale, with a value of 3.98.
Which element has the lowest electronegativity?
Caesium is commonly listed at 0.79 on the Pauling scale and is among the lowest measured values. Some tables discuss francium separately because its value is less directly established.
Does electronegativity increase across a period?
Electronegativity generally increases from left to right across a main-group period because effective nuclear attraction increases while valence electrons remain in the same principal shell.
Does electronegativity decrease down a group?
Electronegativity generally decreases down many groups because added shells increase atomic size and shielding, reducing attraction for shared bonding electrons.
Why are noble-gas electronegativities often blank?
Some electronegativity scales rely on bonding data that are not available or conventional for every noble gas. A blank entry means the chosen scale does not assign a standard value; it does not mean the value is zero.
Is electronegativity measured in units?
Pauling electronegativity is dimensionless. Other definitions may begin from energetic quantities, but raw numbers from different electronegativity scales should not be mixed.
What is electronegativity difference?
Electronegativity difference is the absolute difference between two values on the same scale: Δχ = |χA − χB|. A larger difference usually indicates a more polarized bond.
Does a large electronegativity difference always mean an ionic bond?
No. A large difference supports stronger charge separation, but bonding exists on a continuum and depends on the atoms, structure, and chemical environment.
Is electron affinity the same as electronegativity?
No. Electron affinity is an energy change for adding an electron to an isolated atom, while electronegativity describes attraction for electrons in a bonding context.
Why is oxygen more electronegative than sulfur?
Oxygen is smaller and has less shielding than sulfur, so it attracts shared bonding electrons more strongly. Their Pauling values are about 3.44 and 2.58 respectively.
Why is fluorine more electronegative than chlorine?
Fluorine is smaller and its valence shell is closer to the nucleus, so shared electrons experience stronger attraction. Their Pauling values are 3.98 for F and 3.16 for Cl.
Can electronegativity predict molecular polarity?
Electronegativity helps predict individual bond dipoles, but molecular polarity also depends on geometry. Symmetric bond dipoles can cancel.
Why do different electronegativity charts disagree?
Different charts may use Pauling, Mulliken, Allen, Allred–Rochow, or another scale. Each definition uses different underlying data, so numerical values and some rankings can differ.
What is the electronegativity of carbon?
Carbon is 2.55 on the Pauling scale. This makes C–H bonds only modestly polarized and C–F bonds much more strongly polarized.
What is the electronegativity of chlorine?
Chlorine is 3.16 on the Pauling scale, making it one of the more electronegative common elements and more electronegative than bromine or iodine.
Related ChartsLoom references
Use the Atomic Radius Chart to compare the opposing size trend, the Electron Configuration Chart to connect periodic trends with valence structure, or the Density Chart for a physical-property comparison.
Sources
International Union of Pure and Applied Chemistry — Gold Book — electronegativity
Defines electronegativity, notes that several definitions exist, and describes the commonly used relative Pauling scale.
https://goldbook.iupac.org/terms/view/E01990
Royal Society of Chemistry — Periodic Table — element atomic data
Provides element-by-element Pauling electronegativity values and related atomic data used for reference checks.
https://periodic-table.rsc.org/
Royal Society of Chemistry — Fluorine — element information
Lists fluorine at 3.98 on the Pauling scale, the highest value in the common Pauling reference used here.
https://periodic-table.rsc.org/element/9/fluorine
Royal Society of Chemistry — Caesium — element information
Lists caesium at 0.79 on the Pauling scale and describes electronegativity as a relative tendency to attract electrons.
https://periodic-table.rsc.org/element/55/caesium