Animals & Pets
Aquarium Water Parameters Chart
Compare core water tests across freshwater, planted, cichlid, brackish, marine and reef aquariums. Learn what each number means and how to respond without creating a second shock.
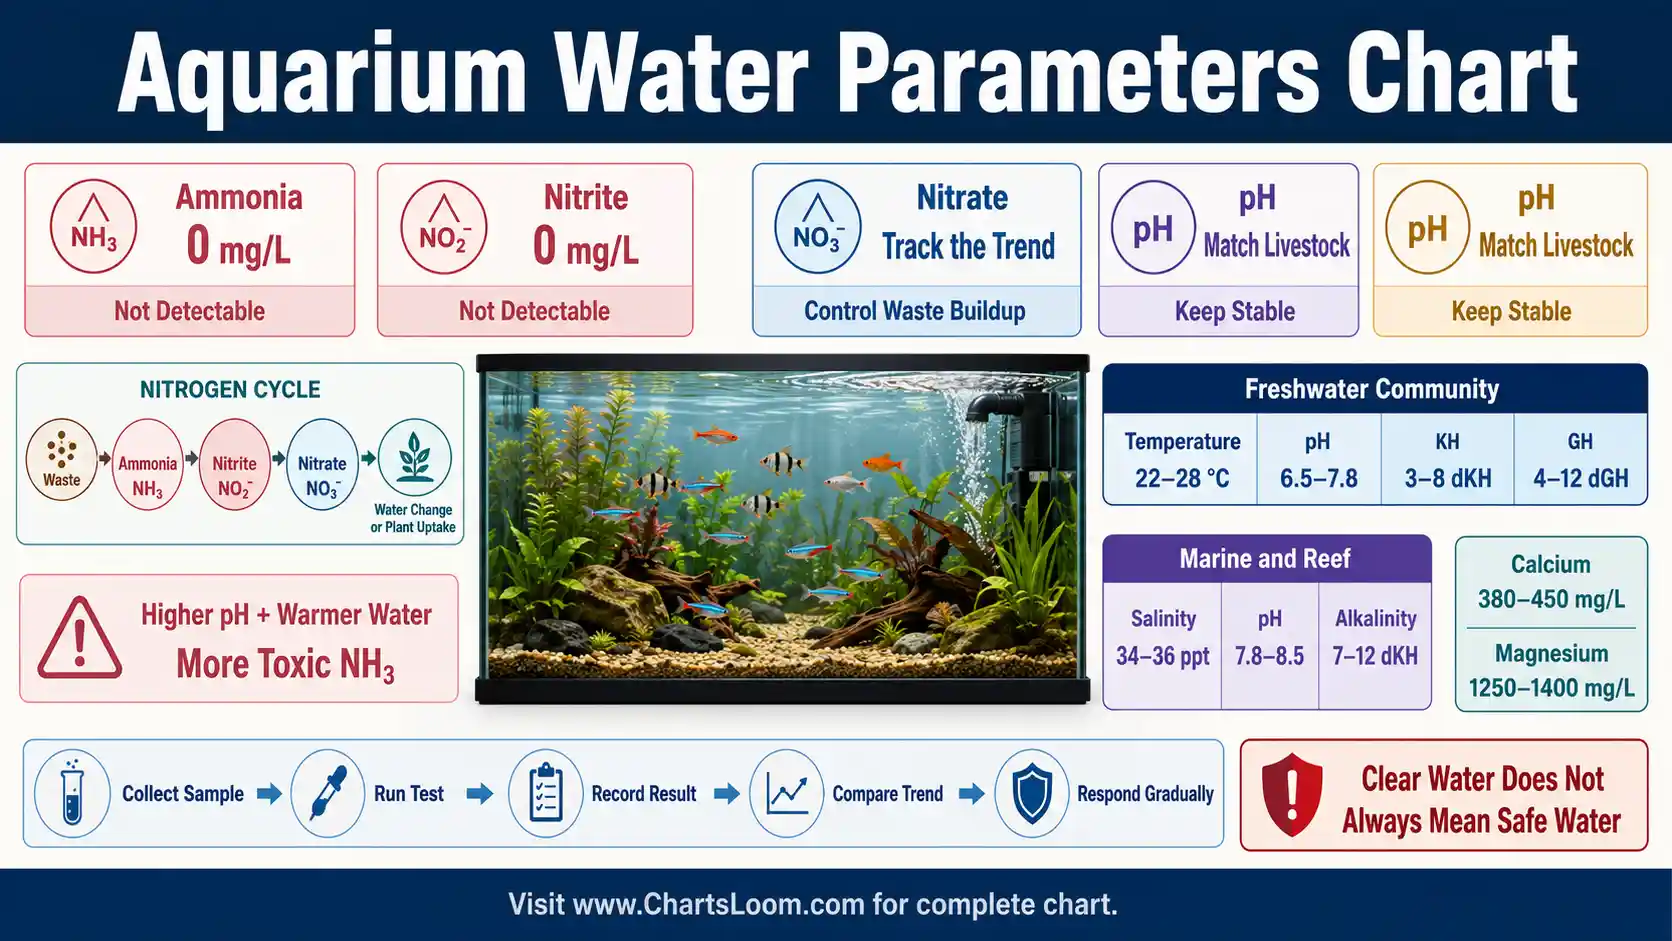
Quick answer
Test trends, not isolated numbers
An established aquarium should not show detectably elevated ammonia or nitrite. pH, hardness, alkalinity, temperature and salinity must match the residents and remain stable. Repeat surprising results before changing chemistry.
Established tank goal
Ammonia and nitrite: not detectable
Confirm every measurable result and review waste input, oxygen and biological filtration.
Best pH rule
Match livestock and keep it stable
A stable species-appropriate pH is safer than chasing a universal number.
Buffering
KH protects pH stability
Low alkalinity can permit sudden pH decline and weaken nitrification.
Safe response
Verify before adjusting
Repeat surprising tests and change temperature, pH or salinity gradually.
Questions at a glance
What should ammonia be?
Ammonia should not be detectably elevated in an established aquarium.
What should nitrite be?
Nitrite should not be detectably elevated in an established aquarium.
What nitrate level is safe?
There is no universal value; use a livestock-specific target and investigate a rising trend.
What is the ideal aquarium pH?
The ideal pH matches the species and remains stable.
Why do pH and temperature change ammonia risk?
Higher pH and warmer water increase the toxic un-ionized NH₃ fraction.
What does KH measure?
KH estimates carbonate buffering that resists pH change.
What does GH measure?
GH mainly reflects dissolved calcium and magnesium.
What salinity is common for reefs?
A broad planning band is about 34–36 ppt, but the selected livestock controls the target.
How often should I test a new tank?
Test ammonia, nitrite, pH and temperature daily during cycling.
Can clear water contain ammonia?
Yes. Many dangerous water-quality problems are invisible.
Should I change all the water after a bad test?
Usually no. Matched partial changes and cause correction are safer than an abrupt total reset.
Can this chart diagnose fish disease?
No. It supports water-quality review but cannot diagnose an animal.
Aquarium Water Parameter Overview
Use this map to understand what each aquarium test measures, why it matters and how to interpret it safely.
Swipe horizontally inside the table to view every column.
| Parameter | Common unit | What it affects | How it is tested | Key interpretation |
|---|---|---|---|---|
| Temperature | °C or °F | Controls metabolism, oxygen capacity and biological filtration | Thermometer | Species-specific; stability matters |
| pH | 0–14 scale | Changes ammonia toxicity and biological processes | Calibrated meter or liquid test | Avoid rapid corrections |
| Total ammonia nitrogen | mg/L | Fish waste and decomposition product | Liquid or photometric test | Not detectable is the aquarium goal |
| Un-ionized ammonia NH3 | mg/L | Most toxic ammonia fraction | Calculated from TAN, pH and temperature | Rises as pH and temperature rise |
| Nitrite | mg/L | Intermediate nitrogen-cycle product | Liquid or photometric test | Not detectable in an established tank |
| Nitrate | mg/L | End product of aerobic nitrification | Liquid or photometric test | Control trend with maintenance |
| Dissolved oxygen | mg/L or % saturation | Supports fish and nitrifying bacteria | DO meter or test | Warm water holds less oxygen |
| Alkalinity / KH | mg/L CaCO3 or dKH | Buffers pH and supplies carbonate | Titration test | Low values permit pH swings |
| General hardness / GH | mg/L CaCO3 or dGH | Reflects calcium and magnesium | Titration test | Match osmoregulatory needs |
| Salinity | ppt or PSU | Total dissolved salts in marine/brackish water | Refractometer or conductivity meter | Temperature-compensate and calibrate |
| Specific gravity | Unitless | Density relative to pure water | Hydrometer or refractometer | Temperature affects reading |
| Conductivity | µS/cm or mS/cm | Tracks ionic concentration | Conductivity meter | Useful for consistency, not identity |
| TDS | mg/L estimate | Estimated dissolved solids | TDS meter | Conversion factor varies |
| Chlorine | mg/L | Municipal disinfectant | Chlorine test | Must be neutralized before use |
| Chloramine | mg/L | Stable municipal disinfectant | Total chlorine/ammonia-aware test | Conditioner must address chloramine |
| Phosphate | mg/L | Nutrient affecting algae and reef balance | Colorimetric test | Interpret with feeding and livestock |
| Calcium | mg/L | Coral skeleton and calcifying organism mineral | Titration or photometer | Important in reef systems |
| Magnesium | mg/L | Supports seawater ionic balance | Titration or photometer | Important in reef systems |
| Copper | mg/L | Medication or contaminant | Low-range copper test | Dangerous to many invertebrates |
| Carbon dioxide | mg/L | Plant carbon source and pH driver | Drop checker or calculated estimate | High levels can reduce oxygen safety |
| ORP | mV | Oxidation-reduction tendency | ORP probe | Trend tool, not a single health score |
| Turbidity | NTU or visual trend | Suspended particles and blooms | Turbidity meter or observation | Cause matters more than clarity alone |
| Flow | Turnover or velocity | Distributes oxygen, heat and nutrients | Flow meter or pump estimate | Resident-specific |
| Source water | Full profile | Sets baseline chemistry | Test before mixing or conditioning | Seasonal changes are possible |
- • No single value is safe for every fish, plant, coral or invertebrate.
- • Trend data from the same method are often more useful than isolated readings.
Download or export
Interactive reference tool
Aquarium water reading checker
Compare one set of test results with a broad aquarium profile. The tool highlights trends to investigate; it does not prescribe additives.
Reading summary
Freshwater community
All entered readings fall inside the selected broad planning bands. Continue testing and compare with each resident’s needs.
Temperature
25 °CPlanning target: 22–28 °C
Inside this broad planning band. Stability and trend still matter.
pH
7.2Planning target: 6.5–7.8
Inside this broad planning band. Stability and trend still matter.
Total ammonia
0 mg/LPlanning target: Not detectable; interpret TAN with pH and temperature
Not detectably elevated at this reading.
Nitrite
0 mg/LPlanning target: Not detectable in an established aquarium
Not detectably elevated at this reading.
Nitrate
20 mg/LPlanning target: 0–40 mg/L planning band
Inside this broad planning band. Stability and trend still matter.
Freshwater estimate: 0.0000 mg/L estimated NH₃
- 1. Repeat any surprising result with a correctly stored, unexpired test and clean sample container.
- 2. Protect oxygenation and biological filtration; avoid replacing all filter media at once.
- 3. Match replacement water for temperature, salinity and pH as closely as practical.
- 4. Record the reading, maintenance action and livestock behavior so trends are visible.
A broad planning profile. Confirm every species and source-water requirement. This tool uses broad educational bands, not a universal prescription. It cannot diagnose disease, verify real-world water, account for every species or tell you to add a specific chemical.
What it does
Checks temperature, pH, nitrogen readings and salinity against one broad planning profile.
Why it helps
It turns several test-kit numbers into a consistent review order and makes trends easier to record.
What it cannot do
It cannot diagnose fish, verify your test, identify livestock, or prescribe a chemical correction.
Freshwater Community Planning Ranges
Broad planning ranges for a freshwater community planning ranges. These are starting points, not universal prescriptions.
Swipe horizontally inside the table to view every column.
| Parameter or case | Planning value | Meaning | Check first | Response principle |
|---|---|---|---|---|
| Temperature | 22–28 °C | Broad tropical community band | Match every species | Record trend before adjusting |
| Temperature — low-side example | Below 22–28 °C | Potential mismatch or test issue | Confirm species and test | Correct gradually if needed |
| Temperature — high-side example | Above 22–28 °C | Potential stress or maintenance issue | Verify before action | Avoid abrupt chemistry change |
| pH | 6.5–7.8 | Broad planning band | Stability usually matters more than chasing 7.0 | Record trend before adjusting |
| pH — low-side example | Below 6.5–7.8 | Potential mismatch or test issue | Confirm species and test | Correct gradually if needed |
| pH — high-side example | Above 6.5–7.8 | Potential stress or maintenance issue | Verify before action | Avoid abrupt chemistry change |
| Ammonia | Not detectable | Established tank target | Retest any detectable result | Record trend before adjusting |
| Ammonia — low-side example | Below Not detectable | Potential mismatch or test issue | Confirm species and test | Correct gradually if needed |
| Ammonia — high-side example | Above Not detectable | Potential stress or maintenance issue | Verify before action | Avoid abrupt chemistry change |
| Nitrite | Not detectable | Established tank target | Review biofilter if detected | Record trend before adjusting |
| Nitrite — low-side example | Below Not detectable | Potential mismatch or test issue | Confirm species and test | Correct gradually if needed |
| Nitrite — high-side example | Above Not detectable | Potential stress or maintenance issue | Verify before action | Avoid abrupt chemistry change |
| Nitrate | Usually below 40 mg/L | Broad husbandry trigger | Sensitive species may need lower | Record trend before adjusting |
| Nitrate — low-side example | Below Usually below 40 mg/L | Potential mismatch or test issue | Confirm species and test | Correct gradually if needed |
| Nitrate — high-side example | Above Usually below 40 mg/L | Potential stress or maintenance issue | Verify before action | Avoid abrupt chemistry change |
| KH | 3–8 dKH | Moderate buffering example | Source water varies | Record trend before adjusting |
| KH — low-side example | Below 3–8 dKH | Potential mismatch or test issue | Confirm species and test | Correct gradually if needed |
| KH — high-side example | Above 3–8 dKH | Potential stress or maintenance issue | Verify before action | Avoid abrupt chemistry change |
| GH | 4–12 dGH | Moderate hardness example | Soft-water species may need lower | Record trend before adjusting |
| GH — low-side example | Below 4–12 dGH | Potential mismatch or test issue | Confirm species and test | Correct gradually if needed |
| GH — high-side example | Above 4–12 dGH | Potential stress or maintenance issue | Verify before action | Avoid abrupt chemistry change |
| Dissolved oxygen | Prefer at least about 5 mg/L | General fish-health planning | Higher for coldwater or crowded tanks | Record trend before adjusting |
| Dissolved oxygen — low-side example | Below Prefer at least about 5 mg/L | Potential mismatch or test issue | Confirm species and test | Correct gradually if needed |
| Dissolved oxygen — high-side example | Above Prefer at least about 5 mg/L | Potential stress or maintenance issue | Verify before action | Avoid abrupt chemistry change |
- • Always research every resident rather than averaging incompatible needs.
- • Use a stable source-water and maintenance plan before adding livestock.
Download or export
Planted Freshwater Planning Ranges
Broad planning ranges for a planted freshwater planning ranges. These are starting points, not universal prescriptions.
Swipe horizontally inside the table to view every column.
| Parameter or case | Planning value | Meaning | Check first | Response principle |
|---|---|---|---|---|
| Temperature | 22–28 °C | Plant and fish compromise | Select plants for temperature | Record trend before adjusting |
| Temperature — low-side example | Below 22–28 °C | Potential mismatch or test issue | Confirm species and test | Correct gradually if needed |
| Temperature — high-side example | Above 22–28 °C | Potential stress or maintenance issue | Verify before action | Avoid abrupt chemistry change |
| pH | 6.0–7.5 | Broad planted band | CO2 changes daily pH | Record trend before adjusting |
| pH — low-side example | Below 6.0–7.5 | Potential mismatch or test issue | Confirm species and test | Correct gradually if needed |
| pH — high-side example | Above 6.0–7.5 | Potential stress or maintenance issue | Verify before action | Avoid abrupt chemistry change |
| Ammonia | Not detectable | Livestock safety target | Plants do not make ammonia safe | Record trend before adjusting |
| Ammonia — low-side example | Below Not detectable | Potential mismatch or test issue | Confirm species and test | Correct gradually if needed |
| Ammonia — high-side example | Above Not detectable | Potential stress or maintenance issue | Verify before action | Avoid abrupt chemistry change |
| Nitrite | Not detectable | Established biofilter target | Investigate any reading | Record trend before adjusting |
| Nitrite — low-side example | Below Not detectable | Potential mismatch or test issue | Confirm species and test | Correct gradually if needed |
| Nitrite — high-side example | Above Not detectable | Potential stress or maintenance issue | Verify before action | Avoid abrupt chemistry change |
| Nitrate | 5–30 mg/L | Plant-available planning band | Do not dose blindly | Record trend before adjusting |
| Nitrate — low-side example | Below 5–30 mg/L | Potential mismatch or test issue | Confirm species and test | Correct gradually if needed |
| Nitrate — high-side example | Above 5–30 mg/L | Potential stress or maintenance issue | Verify before action | Avoid abrupt chemistry change |
| KH | 1–8 dKH | Species and aquascape dependent | Low KH increases swing risk | Record trend before adjusting |
| KH — low-side example | Below 1–8 dKH | Potential mismatch or test issue | Confirm species and test | Correct gradually if needed |
| KH — high-side example | Above 1–8 dKH | Potential stress or maintenance issue | Verify before action | Avoid abrupt chemistry change |
| GH | 3–12 dGH | Calcium/magnesium planning band | Match shrimp and fish | Record trend before adjusting |
| GH — low-side example | Below 3–12 dGH | Potential mismatch or test issue | Confirm species and test | Correct gradually if needed |
| GH — high-side example | Above 3–12 dGH | Potential stress or maintenance issue | Verify before action | Avoid abrupt chemistry change |
| CO2 | Use controlled, monitored addition | Plant growth tool | Fish respiration controls upper limit | Record trend before adjusting |
| CO2 — low-side example | Below Use controlled, monitored addition | Potential mismatch or test issue | Confirm species and test | Correct gradually if needed |
| CO2 — high-side example | Above Use controlled, monitored addition | Potential stress or maintenance issue | Verify before action | Avoid abrupt chemistry change |
- • Always research every resident rather than averaging incompatible needs.
- • Use a stable source-water and maintenance plan before adding livestock.
Download or export
African Rift Lake Cichlid Planning Ranges
Broad planning ranges for a african rift lake cichlid planning ranges. These are starting points, not universal prescriptions.
Swipe horizontally inside the table to view every column.
| Parameter or case | Planning value | Meaning | Check first | Response principle |
|---|---|---|---|---|
| Temperature | 24–28 °C | Common tropical band | Species and lake vary | Record trend before adjusting |
| Temperature — low-side example | Below 24–28 °C | Potential mismatch or test issue | Confirm species and test | Correct gradually if needed |
| Temperature — high-side example | Above 24–28 °C | Potential stress or maintenance issue | Verify before action | Avoid abrupt chemistry change |
| pH | 7.8–8.6 | Broad alkaline band | Do not force rapid changes | Record trend before adjusting |
| pH — low-side example | Below 7.8–8.6 | Potential mismatch or test issue | Confirm species and test | Correct gradually if needed |
| pH — high-side example | Above 7.8–8.6 | Potential stress or maintenance issue | Verify before action | Avoid abrupt chemistry change |
| Ammonia | Not detectable | High pH increases NH3 fraction | Treat any detection seriously | Record trend before adjusting |
| Ammonia — low-side example | Below Not detectable | Potential mismatch or test issue | Confirm species and test | Correct gradually if needed |
| Ammonia — high-side example | Above Not detectable | Potential stress or maintenance issue | Verify before action | Avoid abrupt chemistry change |
| Nitrite | Not detectable | Established tank target | Chloride can affect nitrite toxicity but is not a cure | Record trend before adjusting |
| Nitrite — low-side example | Below Not detectable | Potential mismatch or test issue | Confirm species and test | Correct gradually if needed |
| Nitrite — high-side example | Above Not detectable | Potential stress or maintenance issue | Verify before action | Avoid abrupt chemistry change |
| Nitrate | Usually below 40 mg/L | Broad maintenance trigger | Lower is often preferable | Record trend before adjusting |
| Nitrate — low-side example | Below Usually below 40 mg/L | Potential mismatch or test issue | Confirm species and test | Correct gradually if needed |
| Nitrate — high-side example | Above Usually below 40 mg/L | Potential stress or maintenance issue | Verify before action | Avoid abrupt chemistry change |
| KH | 8–18 dKH | Strong buffering example | Lake-specific needs differ | Record trend before adjusting |
| KH — low-side example | Below 8–18 dKH | Potential mismatch or test issue | Confirm species and test | Correct gradually if needed |
| KH — high-side example | Above 8–18 dKH | Potential stress or maintenance issue | Verify before action | Avoid abrupt chemistry change |
| GH | 8–20 dGH | Hard-water example | Verify source and species | Record trend before adjusting |
| GH — low-side example | Below 8–20 dGH | Potential mismatch or test issue | Confirm species and test | Correct gradually if needed |
| GH — high-side example | Above 8–20 dGH | Potential stress or maintenance issue | Verify before action | Avoid abrupt chemistry change |
| Salinity | Freshwater | Do not use marine salinity | Salt use is situation-specific | Record trend before adjusting |
| Salinity — low-side example | Below Freshwater | Potential mismatch or test issue | Confirm species and test | Correct gradually if needed |
| Salinity — high-side example | Above Freshwater | Potential stress or maintenance issue | Verify before action | Avoid abrupt chemistry change |
- • Always research every resident rather than averaging incompatible needs.
- • Use a stable source-water and maintenance plan before adding livestock.
Download or export
Brackish Aquarium Planning Ranges
Broad planning ranges for a brackish aquarium planning ranges. These are starting points, not universal prescriptions.
Swipe horizontally inside the table to view every column.
| Parameter or case | Planning value | Meaning | Check first | Response principle |
|---|---|---|---|---|
| Temperature | 24–28 °C | Common tropical brackish band | Species may differ | Record trend before adjusting |
| Temperature — low-side example | Below 24–28 °C | Potential mismatch or test issue | Confirm species and test | Correct gradually if needed |
| Temperature — high-side example | Above 24–28 °C | Potential stress or maintenance issue | Verify before action | Avoid abrupt chemistry change |
| pH | 7.5–8.5 | Broad alkaline band | Avoid rapid shifts | Record trend before adjusting |
| pH — low-side example | Below 7.5–8.5 | Potential mismatch or test issue | Confirm species and test | Correct gradually if needed |
| pH — high-side example | Above 7.5–8.5 | Potential stress or maintenance issue | Verify before action | Avoid abrupt chemistry change |
| Ammonia | Not detectable | Established system target | Interpret with pH and salinity | Record trend before adjusting |
| Ammonia — low-side example | Below Not detectable | Potential mismatch or test issue | Confirm species and test | Correct gradually if needed |
| Ammonia — high-side example | Above Not detectable | Potential stress or maintenance issue | Verify before action | Avoid abrupt chemistry change |
| Nitrite | Not detectable | Established system target | Retest any detection | Record trend before adjusting |
| Nitrite — low-side example | Below Not detectable | Potential mismatch or test issue | Confirm species and test | Correct gradually if needed |
| Nitrite — high-side example | Above Not detectable | Potential stress or maintenance issue | Verify before action | Avoid abrupt chemistry change |
| Nitrate | Usually below 40 mg/L | Broad trigger | Sensitive animals may need lower | Record trend before adjusting |
| Nitrate — low-side example | Below Usually below 40 mg/L | Potential mismatch or test issue | Confirm species and test | Correct gradually if needed |
| Nitrate — high-side example | Above Usually below 40 mg/L | Potential stress or maintenance issue | Verify before action | Avoid abrupt chemistry change |
| Salinity | 5–20 ppt | Broad brackish planning band | Species and life stage control target | Record trend before adjusting |
| Salinity — low-side example | Below 5–20 ppt | Potential mismatch or test issue | Confirm species and test | Correct gradually if needed |
| Salinity — high-side example | Above 5–20 ppt | Potential stress or maintenance issue | Verify before action | Avoid abrupt chemistry change |
| Specific gravity | Approximately 1.004–1.015 | Temperature-dependent estimate | Use salinity when possible | Record trend before adjusting |
| Specific gravity — low-side example | Below Approximately 1.004–1.015 | Potential mismatch or test issue | Confirm species and test | Correct gradually if needed |
| Specific gravity — high-side example | Above Approximately 1.004–1.015 | Potential stress or maintenance issue | Verify before action | Avoid abrupt chemistry change |
| Acclimation | Gradual and measured | Match transfer water | Never guess by salt quantity alone | Record trend before adjusting |
| Acclimation — low-side example | Below Gradual and measured | Potential mismatch or test issue | Confirm species and test | Correct gradually if needed |
| Acclimation — high-side example | Above Gradual and measured | Potential stress or maintenance issue | Verify before action | Avoid abrupt chemistry change |
- • Always research every resident rather than averaging incompatible needs.
- • Use a stable source-water and maintenance plan before adding livestock.
Download or export
Marine Fish-Only Planning Ranges
Broad planning ranges for a marine fish-only planning ranges. These are starting points, not universal prescriptions.
Swipe horizontally inside the table to view every column.
| Parameter or case | Planning value | Meaning | Check first | Response principle |
|---|---|---|---|---|
| Temperature | 24–27 °C | Common tropical marine band | Species may differ | Record trend before adjusting |
| Temperature — low-side example | Below 24–27 °C | Potential mismatch or test issue | Confirm species and test | Correct gradually if needed |
| Temperature — high-side example | Above 24–27 °C | Potential stress or maintenance issue | Verify before action | Avoid abrupt chemistry change |
| pH | 8.0–8.4 | Broad marine band | Daily cycle is normal | Record trend before adjusting |
| pH — low-side example | Below 8.0–8.4 | Potential mismatch or test issue | Confirm species and test | Correct gradually if needed |
| pH — high-side example | Above 8.0–8.4 | Potential stress or maintenance issue | Verify before action | Avoid abrupt chemistry change |
| Ammonia | Not detectable | Established system target | Any detection deserves review | Record trend before adjusting |
| Ammonia — low-side example | Below Not detectable | Potential mismatch or test issue | Confirm species and test | Correct gradually if needed |
| Ammonia — high-side example | Above Not detectable | Potential stress or maintenance issue | Verify before action | Avoid abrupt chemistry change |
| Nitrite | Not detectable | Established system target | Marine toxicity differs but zero is the goal | Record trend before adjusting |
| Nitrite — low-side example | Below Not detectable | Potential mismatch or test issue | Confirm species and test | Correct gradually if needed |
| Nitrite — high-side example | Above Not detectable | Potential stress or maintenance issue | Verify before action | Avoid abrupt chemistry change |
| Nitrate | Usually below 40 mg/L | Broad fish-only trigger | Invertebrates may need lower | Record trend before adjusting |
| Nitrate — low-side example | Below Usually below 40 mg/L | Potential mismatch or test issue | Confirm species and test | Correct gradually if needed |
| Nitrate — high-side example | Above Usually below 40 mg/L | Potential stress or maintenance issue | Verify before action | Avoid abrupt chemistry change |
| Salinity | 30–35 ppt | Broad marine band | Match replacement water | Record trend before adjusting |
| Salinity — low-side example | Below 30–35 ppt | Potential mismatch or test issue | Confirm species and test | Correct gradually if needed |
| Salinity — high-side example | Above 30–35 ppt | Potential stress or maintenance issue | Verify before action | Avoid abrupt chemistry change |
| Specific gravity | Approximately 1.022–1.026 | Temperature dependent | Calibrate instrument | Record trend before adjusting |
| Specific gravity — low-side example | Below Approximately 1.022–1.026 | Potential mismatch or test issue | Confirm species and test | Correct gradually if needed |
| Specific gravity — high-side example | Above Approximately 1.022–1.026 | Potential stress or maintenance issue | Verify before action | Avoid abrupt chemistry change |
| Alkalinity | Track consistently | Supports pH stability | Use one unit consistently | Record trend before adjusting |
| Alkalinity — low-side example | Below Track consistently | Potential mismatch or test issue | Confirm species and test | Correct gradually if needed |
| Alkalinity — high-side example | Above Track consistently | Potential stress or maintenance issue | Verify before action | Avoid abrupt chemistry change |
- • Always research every resident rather than averaging incompatible needs.
- • Use a stable source-water and maintenance plan before adding livestock.
Download or export
Reef Aquarium Planning Ranges
Broad planning ranges for a reef aquarium planning ranges. These are starting points, not universal prescriptions.
Swipe horizontally inside the table to view every column.
| Parameter or case | Planning value | Meaning | Check first | Response principle |
|---|---|---|---|---|
| Temperature | 24–27 °C | Common tropical reef band | Avoid heater swings | Record trend before adjusting |
| Temperature — low-side example | Below 24–27 °C | Potential mismatch or test issue | Confirm species and test | Correct gradually if needed |
| Temperature — high-side example | Above 24–27 °C | Potential stress or maintenance issue | Verify before action | Avoid abrupt chemistry change |
| pH | 7.8–8.5 | Broad daily band | Trend with lighting cycle | Record trend before adjusting |
| pH — low-side example | Below 7.8–8.5 | Potential mismatch or test issue | Confirm species and test | Correct gradually if needed |
| pH — high-side example | Above 7.8–8.5 | Potential stress or maintenance issue | Verify before action | Avoid abrupt chemistry change |
| Ammonia | Not detectable | Established reef target | Protect oxygen and biofilter | Record trend before adjusting |
| Ammonia — low-side example | Below Not detectable | Potential mismatch or test issue | Confirm species and test | Correct gradually if needed |
| Ammonia — high-side example | Above Not detectable | Potential stress or maintenance issue | Verify before action | Avoid abrupt chemistry change |
| Nitrite | Not detectable | Established reef target | Verify unexpected detection | Record trend before adjusting |
| Nitrite — low-side example | Below Not detectable | Potential mismatch or test issue | Confirm species and test | Correct gradually if needed |
| Nitrite — high-side example | Above Not detectable | Potential stress or maintenance issue | Verify before action | Avoid abrupt chemistry change |
| Nitrate | 1–20 mg/L | Broad mixed-reef planning band | Coral goals differ | Record trend before adjusting |
| Nitrate — low-side example | Below 1–20 mg/L | Potential mismatch or test issue | Confirm species and test | Correct gradually if needed |
| Nitrate — high-side example | Above 1–20 mg/L | Potential stress or maintenance issue | Verify before action | Avoid abrupt chemistry change |
| Salinity | 34–36 ppt | Near-natural seawater band | Top off evaporation with fresh water | Record trend before adjusting |
| Salinity — low-side example | Below 34–36 ppt | Potential mismatch or test issue | Confirm species and test | Correct gradually if needed |
| Salinity — high-side example | Above 34–36 ppt | Potential stress or maintenance issue | Verify before action | Avoid abrupt chemistry change |
| Alkalinity | 7–12 dKH | Broad reef planning band | Stability is critical | Record trend before adjusting |
| Alkalinity — low-side example | Below 7–12 dKH | Potential mismatch or test issue | Confirm species and test | Correct gradually if needed |
| Alkalinity — high-side example | Above 7–12 dKH | Potential stress or maintenance issue | Verify before action | Avoid abrupt chemistry change |
| Calcium | 380–450 mg/L | Broad calcification band | Interpret with alkalinity | Record trend before adjusting |
| Calcium — low-side example | Below 380–450 mg/L | Potential mismatch or test issue | Confirm species and test | Correct gradually if needed |
| Calcium — high-side example | Above 380–450 mg/L | Potential stress or maintenance issue | Verify before action | Avoid abrupt chemistry change |
| Magnesium | 1250–1400 mg/L | Broad seawater band | Supports ionic balance | Record trend before adjusting |
| Magnesium — low-side example | Below 1250–1400 mg/L | Potential mismatch or test issue | Confirm species and test | Correct gradually if needed |
| Magnesium — high-side example | Above 1250–1400 mg/L | Potential stress or maintenance issue | Verify before action | Avoid abrupt chemistry change |
| Phosphate | 0.02–0.10 mg/L | Broad mixed-reef planning band | Avoid sudden nutrient stripping | Record trend before adjusting |
| Phosphate — low-side example | Below 0.02–0.10 mg/L | Potential mismatch or test issue | Confirm species and test | Correct gradually if needed |
| Phosphate — high-side example | Above 0.02–0.10 mg/L | Potential stress or maintenance issue | Verify before action | Avoid abrupt chemistry change |
- • Always research every resident rather than averaging incompatible needs.
- • Use a stable source-water and maintenance plan before adding livestock.
Download or export
Aquarium Nitrogen Cycle and Biofilter Chart
Follow how nitrogen waste moves through an aquarium and where common disruptions appear.
Swipe horizontally inside the table to view every column.
| Stage | Process | Water result | Management focus | Typical context |
|---|---|---|---|---|
| Waste input — example 1 | Food, feces, respiration and decay | Ammonia enters water | Feed carefully; remove debris | New setup |
| Ammonia oxidation — example 1 | Ammonia-oxidizing microbes | Ammonia becomes nitrite | Needs oxygen, surface area and alkalinity | New setup |
| Nitrite oxidation — example 1 | Nitrite-oxidizing microbes | Nitrite becomes nitrate | Needs oxygen and stable biofilter | New setup |
| Nitrate control — example 1 | Water changes, plants or denitrification | Nitrate is exported or consumed | Track trend | New setup |
| Cycle disruption — example 1 | Media replacement, medication, low oxygen or overload | Ammonia/nitrite may reappear | Test more often | New setup |
| Waste input — example 2 | Food, feces, respiration and decay | Ammonia enters water | Feed carefully; remove debris | Added fish |
| Ammonia oxidation — example 2 | Ammonia-oxidizing microbes | Ammonia becomes nitrite | Needs oxygen, surface area and alkalinity | Added fish |
| Nitrite oxidation — example 2 | Nitrite-oxidizing microbes | Nitrite becomes nitrate | Needs oxygen and stable biofilter | Added fish |
| Nitrate control — example 2 | Water changes, plants or denitrification | Nitrate is exported or consumed | Track trend | Added fish |
| Cycle disruption — example 2 | Media replacement, medication, low oxygen or overload | Ammonia/nitrite may reappear | Test more often | Added fish |
| Waste input — example 3 | Food, feces, respiration and decay | Ammonia enters water | Feed carefully; remove debris | Filter cleaning |
| Ammonia oxidation — example 3 | Ammonia-oxidizing microbes | Ammonia becomes nitrite | Needs oxygen, surface area and alkalinity | Filter cleaning |
| Nitrite oxidation — example 3 | Nitrite-oxidizing microbes | Nitrite becomes nitrate | Needs oxygen and stable biofilter | Filter cleaning |
| Nitrate control — example 3 | Water changes, plants or denitrification | Nitrate is exported or consumed | Track trend | Filter cleaning |
| Cycle disruption — example 3 | Media replacement, medication, low oxygen or overload | Ammonia/nitrite may reappear | Test more often | Filter cleaning |
| Waste input — example 4 | Food, feces, respiration and decay | Ammonia enters water | Feed carefully; remove debris | Power outage |
| Ammonia oxidation — example 4 | Ammonia-oxidizing microbes | Ammonia becomes nitrite | Needs oxygen, surface area and alkalinity | Power outage |
| Nitrite oxidation — example 4 | Nitrite-oxidizing microbes | Nitrite becomes nitrate | Needs oxygen and stable biofilter | Power outage |
| Nitrate control — example 4 | Water changes, plants or denitrification | Nitrate is exported or consumed | Track trend | Power outage |
| Cycle disruption — example 4 | Media replacement, medication, low oxygen or overload | Ammonia/nitrite may reappear | Test more often | Power outage |
| Waste input — example 5 | Food, feces, respiration and decay | Ammonia enters water | Feed carefully; remove debris | Overfeeding |
| Ammonia oxidation — example 5 | Ammonia-oxidizing microbes | Ammonia becomes nitrite | Needs oxygen, surface area and alkalinity | Overfeeding |
| Nitrite oxidation — example 5 | Nitrite-oxidizing microbes | Nitrite becomes nitrate | Needs oxygen and stable biofilter | Overfeeding |
| Nitrate control — example 5 | Water changes, plants or denitrification | Nitrate is exported or consumed | Track trend | Overfeeding |
| Cycle disruption — example 5 | Media replacement, medication, low oxygen or overload | Ammonia/nitrite may reappear | Test more often | Overfeeding |
| Waste input — example 6 | Food, feces, respiration and decay | Ammonia enters water | Feed carefully; remove debris | Medication |
| Ammonia oxidation — example 6 | Ammonia-oxidizing microbes | Ammonia becomes nitrite | Needs oxygen, surface area and alkalinity | Medication |
| Nitrite oxidation — example 6 | Nitrite-oxidizing microbes | Nitrite becomes nitrate | Needs oxygen and stable biofilter | Medication |
| Nitrate control — example 6 | Water changes, plants or denitrification | Nitrate is exported or consumed | Track trend | Medication |
| Cycle disruption — example 6 | Media replacement, medication, low oxygen or overload | Ammonia/nitrite may reappear | Test more often | Medication |
- • A cycled aquarium can still lose capacity after overload, oxygen loss or major media disruption.
- • Ammonia and nitrite should be monitored daily during startup or whenever they are detectable.
Download or export
Ammonia, pH and Temperature Interaction
Estimated freshwater percentage of total ammonia present as toxic un-ionized NH₃.
Swipe horizontally inside the table to view every column.
| Temperature | pH | Estimated NH₃ fraction | Direction of risk | Testing note |
|---|---|---|---|---|
| 18 °C | 6.5 | 0.108% | Higher pH and temperature increase NH₃ fraction | Use TAN, pH and temperature from one sample |
| 18 °C | 7.0 | 0.340% | Higher pH and temperature increase NH₃ fraction | Use TAN, pH and temperature from one sample |
| 18 °C | 7.5 | 1.069% | Higher pH and temperature increase NH₃ fraction | Use TAN, pH and temperature from one sample |
| 18 °C | 8.0 | 3.303% | Higher pH and temperature increase NH₃ fraction | Use TAN, pH and temperature from one sample |
| 18 °C | 8.5 | 9.749% | Higher pH and temperature increase NH₃ fraction | Use TAN, pH and temperature from one sample |
| 18 °C | 9.0 | 25.461% | Higher pH and temperature increase NH₃ fraction | Use TAN, pH and temperature from one sample |
| 18 °C | 9.5 | 51.927% | Higher pH and temperature increase NH₃ fraction | Use TAN, pH and temperature from one sample |
| 18 °C | 10.0 | 77.354% | Higher pH and temperature increase NH₃ fraction | Use TAN, pH and temperature from one sample |
| 18 °C | 6.8 | 0.215% | Higher pH and temperature increase NH₃ fraction | Use TAN, pH and temperature from one sample |
| 22 °C | 6.5 | 0.145% | Higher pH and temperature increase NH₃ fraction | Use TAN, pH and temperature from one sample |
| 22 °C | 7.0 | 0.456% | Higher pH and temperature increase NH₃ fraction | Use TAN, pH and temperature from one sample |
| 22 °C | 7.5 | 1.427% | Higher pH and temperature increase NH₃ fraction | Use TAN, pH and temperature from one sample |
| 22 °C | 8.0 | 4.376% | Higher pH and temperature increase NH₃ fraction | Use TAN, pH and temperature from one sample |
| 22 °C | 8.5 | 12.643% | Higher pH and temperature increase NH₃ fraction | Use TAN, pH and temperature from one sample |
| 22 °C | 9.0 | 31.398% | Higher pH and temperature increase NH₃ fraction | Use TAN, pH and temperature from one sample |
| 22 °C | 9.5 | 59.139% | Higher pH and temperature increase NH₃ fraction | Use TAN, pH and temperature from one sample |
| 22 °C | 10.0 | 82.068% | Higher pH and temperature increase NH₃ fraction | Use TAN, pH and temperature from one sample |
| 22 °C | 6.8 | 0.288% | Higher pH and temperature increase NH₃ fraction | Use TAN, pH and temperature from one sample |
| 25 °C | 6.5 | 0.179% | Higher pH and temperature increase NH₃ fraction | Use TAN, pH and temperature from one sample |
| 25 °C | 7.0 | 0.564% | Higher pH and temperature increase NH₃ fraction | Use TAN, pH and temperature from one sample |
| 25 °C | 7.5 | 1.762% | Higher pH and temperature increase NH₃ fraction | Use TAN, pH and temperature from one sample |
| 25 °C | 8.0 | 5.366% | Higher pH and temperature increase NH₃ fraction | Use TAN, pH and temperature from one sample |
| 25 °C | 8.5 | 15.205% | Higher pH and temperature increase NH₃ fraction | Use TAN, pH and temperature from one sample |
| 25 °C | 9.0 | 36.186% | Higher pH and temperature increase NH₃ fraction | Use TAN, pH and temperature from one sample |
| 25 °C | 9.5 | 64.198% | Higher pH and temperature increase NH₃ fraction | Use TAN, pH and temperature from one sample |
| 25 °C | 10.0 | 85.009% | Higher pH and temperature increase NH₃ fraction | Use TAN, pH and temperature from one sample |
| 25 °C | 6.8 | 0.357% | Higher pH and temperature increase NH₃ fraction | Use TAN, pH and temperature from one sample |
| 28 °C | 6.5 | 0.221% | Higher pH and temperature increase NH₃ fraction | Use TAN, pH and temperature from one sample |
| 28 °C | 7.0 | 0.695% | Higher pH and temperature increase NH₃ fraction | Use TAN, pH and temperature from one sample |
| 28 °C | 7.5 | 2.164% | Higher pH and temperature increase NH₃ fraction | Use TAN, pH and temperature from one sample |
| 28 °C | 8.0 | 6.538% | Higher pH and temperature increase NH₃ fraction | Use TAN, pH and temperature from one sample |
| 28 °C | 8.5 | 18.115% | Higher pH and temperature increase NH₃ fraction | Use TAN, pH and temperature from one sample |
| 28 °C | 9.0 | 41.162% | Higher pH and temperature increase NH₃ fraction | Use TAN, pH and temperature from one sample |
| 28 °C | 9.5 | 68.869% | Higher pH and temperature increase NH₃ fraction | Use TAN, pH and temperature from one sample |
| 28 °C | 10.0 | 87.493% | Higher pH and temperature increase NH₃ fraction | Use TAN, pH and temperature from one sample |
| 28 °C | 6.8 | 0.439% | Higher pH and temperature increase NH₃ fraction | Use TAN, pH and temperature from one sample |
Percent of TAN estimated as NH₃
- • This calculation is an educational freshwater estimate and does not replace species-specific toxicology.
- • Salinity changes ammonia chemistry; do not use these percentages as a marine dosing rule.
Download or export
Aquarium KH, GH and Hardness Conversion Chart
Convert German degrees to mg/L as CaCO₃ and distinguish hardness from buffering.
Swipe horizontally inside the table to view every column.
| Degree or reference | Equivalent | Broad class | Interpretation | Common mistake |
|---|---|---|---|---|
| 0 dH | 0 mg/L as CaCO₃ | Very soft | GH measures calcium and magnesium; KH measures buffering | Do not treat GH and KH as interchangeable |
| 1 dH | 18 mg/L as CaCO₃ | Very soft | GH measures calcium and magnesium; KH measures buffering | Do not treat GH and KH as interchangeable |
| 2 dH | 36 mg/L as CaCO₃ | Very soft | GH measures calcium and magnesium; KH measures buffering | Do not treat GH and KH as interchangeable |
| 3 dH | 54 mg/L as CaCO₃ | Very soft | GH measures calcium and magnesium; KH measures buffering | Do not treat GH and KH as interchangeable |
| 4 dH | 71 mg/L as CaCO₃ | Moderately hard | GH measures calcium and magnesium; KH measures buffering | Do not treat GH and KH as interchangeable |
| 5 dH | 89 mg/L as CaCO₃ | Moderately hard | GH measures calcium and magnesium; KH measures buffering | Do not treat GH and KH as interchangeable |
| 6 dH | 107 mg/L as CaCO₃ | Moderately hard | GH measures calcium and magnesium; KH measures buffering | Do not treat GH and KH as interchangeable |
| 7 dH | 125 mg/L as CaCO₃ | Hard | GH measures calcium and magnesium; KH measures buffering | Do not treat GH and KH as interchangeable |
| 8 dH | 143 mg/L as CaCO₃ | Hard | GH measures calcium and magnesium; KH measures buffering | Do not treat GH and KH as interchangeable |
| 9 dH | 161 mg/L as CaCO₃ | Hard | GH measures calcium and magnesium; KH measures buffering | Do not treat GH and KH as interchangeable |
| 10 dH | 178 mg/L as CaCO₃ | Hard | GH measures calcium and magnesium; KH measures buffering | Do not treat GH and KH as interchangeable |
| 11 dH | 196 mg/L as CaCO₃ | Very hard | GH measures calcium and magnesium; KH measures buffering | Do not treat GH and KH as interchangeable |
| 12 dH | 214 mg/L as CaCO₃ | Very hard | GH measures calcium and magnesium; KH measures buffering | Do not treat GH and KH as interchangeable |
| 13 dH | 232 mg/L as CaCO₃ | Very hard | GH measures calcium and magnesium; KH measures buffering | Do not treat GH and KH as interchangeable |
| 14 dH | 250 mg/L as CaCO₃ | Very hard | GH measures calcium and magnesium; KH measures buffering | Do not treat GH and KH as interchangeable |
| 15 dH | 268 mg/L as CaCO₃ | Very hard | GH measures calcium and magnesium; KH measures buffering | Do not treat GH and KH as interchangeable |
| 16 dH | 286 mg/L as CaCO₃ | Very hard | GH measures calcium and magnesium; KH measures buffering | Do not treat GH and KH as interchangeable |
| 17 dH | 303 mg/L as CaCO₃ | Very hard | GH measures calcium and magnesium; KH measures buffering | Do not treat GH and KH as interchangeable |
| 18 dH | 321 mg/L as CaCO₃ | Very hard | GH measures calcium and magnesium; KH measures buffering | Do not treat GH and KH as interchangeable |
| 19 dH | 339 mg/L as CaCO₃ | Very hard | GH measures calcium and magnesium; KH measures buffering | Do not treat GH and KH as interchangeable |
| Low alkalinity | <50 mg/L | Buffering reference | Track pH stability | Use consistent units |
| Moderate alkalinity | 100–250 mg/L | Buffering reference | Track pH stability | Use consistent units |
| High alkalinity | >250 mg/L | Buffering reference | Track pH stability | Use consistent units |
| Conversion | 1 dKH ≈ 17.848 mg/L CaCO₃ | Buffering reference | Track pH stability | Use consistent units |
- • GH and KH can move independently.
- • Low alkalinity can permit major pH shifts and reduce nitrification resilience.
Download or export
Aquarium Salinity and Specific Gravity Chart
Approximate salinity-to-specific-gravity relationships for planning and instrument checks.
Swipe horizontally inside the table to view every column.
| Salinity | Approximate specific gravity | Broad zone | Precision note | Best practice |
|---|---|---|---|---|
| 0 ppt | ≈ 1.000 | Freshwater | Approximation only | Use a calibrated refractometer or conductivity meter |
| 2 ppt | ≈ 1.002 | Low brackish | Approximation only | Use a calibrated refractometer or conductivity meter |
| 4 ppt | ≈ 1.003 | Low brackish | Approximation only | Use a calibrated refractometer or conductivity meter |
| 6 ppt | ≈ 1.004 | Low brackish | Approximation only | Use a calibrated refractometer or conductivity meter |
| 8 ppt | ≈ 1.006 | Low brackish | Approximation only | Use a calibrated refractometer or conductivity meter |
| 10 ppt | ≈ 1.008 | Low brackish | Approximation only | Use a calibrated refractometer or conductivity meter |
| 12 ppt | ≈ 1.009 | Brackish | Approximation only | Use a calibrated refractometer or conductivity meter |
| 14 ppt | ≈ 1.010 | Brackish | Approximation only | Use a calibrated refractometer or conductivity meter |
| 16 ppt | ≈ 1.012 | Brackish | Approximation only | Use a calibrated refractometer or conductivity meter |
| 18 ppt | ≈ 1.014 | Brackish | Approximation only | Use a calibrated refractometer or conductivity meter |
| 20 ppt | ≈ 1.015 | Brackish | Approximation only | Use a calibrated refractometer or conductivity meter |
| 22 ppt | ≈ 1.016 | High brackish | Approximation only | Use a calibrated refractometer or conductivity meter |
| 24 ppt | ≈ 1.018 | High brackish | Approximation only | Use a calibrated refractometer or conductivity meter |
| 26 ppt | ≈ 1.020 | High brackish | Approximation only | Use a calibrated refractometer or conductivity meter |
| 28 ppt | ≈ 1.021 | High brackish | Approximation only | Use a calibrated refractometer or conductivity meter |
| 30 ppt | ≈ 1.022 | Marine | Approximation only | Use a calibrated refractometer or conductivity meter |
| 32 ppt | ≈ 1.024 | Marine | Approximation only | Use a calibrated refractometer or conductivity meter |
| 34 ppt | ≈ 1.026 | Marine | Approximation only | Use a calibrated refractometer or conductivity meter |
| 36 ppt | ≈ 1.027 | Marine | Approximation only | Use a calibrated refractometer or conductivity meter |
| 38 ppt | ≈ 1.028 | Above common marine band | Approximation only | Use a calibrated refractometer or conductivity meter |
| 40 ppt | ≈ 1.030 | Above common marine band | Approximation only | Use a calibrated refractometer or conductivity meter |
| 42 ppt | ≈ 1.032 | Above common marine band | Approximation only | Use a calibrated refractometer or conductivity meter |
| 44 ppt | ≈ 1.033 | Above common marine band | Approximation only | Use a calibrated refractometer or conductivity meter |
| 46 ppt | ≈ 1.034 | Above common marine band | Approximation only | Use a calibrated refractometer or conductivity meter |
- • Specific gravity depends on temperature and instrument calibration.
- • Top off marine evaporation with fresh water because salt remains behind.
Download or export
Aquarium Water Testing Frequency Chart
Choose testing frequency based on system maturity, livestock changes and observed risk.
Swipe horizontally inside the table to view every column.
| Situation | Priority tests | Suggested frequency | Recordkeeping | Escalation rule |
|---|---|---|---|---|
| New cycle | Ammonia · nitrite · pH · temperature | Daily or immediately | Record results | Increase frequency when ammonia or nitrite are detectable |
| New cycle — extended panel | Nitrate · KH/alkalinity · GH or salinity | Weekly to monthly by system | Use the same method | Reef systems may need calcium, magnesium and phosphate |
| Established freshwater | Ammonia · nitrite · pH · temperature | As needed plus regular schedule | Record results | Increase frequency when ammonia or nitrite are detectable |
| Established freshwater — extended panel | Nitrate · KH/alkalinity · GH or salinity | Weekly to monthly by system | Use the same method | Reef systems may need calcium, magnesium and phosphate |
| Established marine | Ammonia · nitrite · pH · temperature | As needed plus regular schedule | Record results | Increase frequency when ammonia or nitrite are detectable |
| Established marine — extended panel | Nitrate · KH/alkalinity · GH or salinity | Weekly to monthly by system | Use the same method | Reef systems may need calcium, magnesium and phosphate |
| Reef dosing change | Ammonia · nitrite · pH · temperature | As needed plus regular schedule | Record results | Increase frequency when ammonia or nitrite are detectable |
| Reef dosing change — extended panel | Nitrate · KH/alkalinity · GH or salinity | Weekly to monthly by system | Use the same method | Reef systems may need calcium, magnesium and phosphate |
| After adding livestock | Ammonia · nitrite · pH · temperature | As needed plus regular schedule | Record results | Increase frequency when ammonia or nitrite are detectable |
| After adding livestock — extended panel | Nitrate · KH/alkalinity · GH or salinity | Weekly to monthly by system | Use the same method | Reef systems may need calcium, magnesium and phosphate |
| After filter cleaning | Ammonia · nitrite · pH · temperature | As needed plus regular schedule | Record results | Increase frequency when ammonia or nitrite are detectable |
| After filter cleaning — extended panel | Nitrate · KH/alkalinity · GH or salinity | Weekly to monthly by system | Use the same method | Reef systems may need calcium, magnesium and phosphate |
| After power outage | Ammonia · nitrite · pH · temperature | Daily or immediately | Record results | Increase frequency when ammonia or nitrite are detectable |
| After power outage — extended panel | Nitrate · KH/alkalinity · GH or salinity | Weekly to monthly by system | Use the same method | Reef systems may need calcium, magnesium and phosphate |
| When fish breathe fast | Ammonia · nitrite · pH · temperature | Daily or immediately | Record results | Increase frequency when ammonia or nitrite are detectable |
| When fish breathe fast — extended panel | Nitrate · KH/alkalinity · GH or salinity | Weekly to monthly by system | Use the same method | Reef systems may need calcium, magnesium and phosphate |
| After overfeeding | Ammonia · nitrite · pH · temperature | As needed plus regular schedule | Record results | Increase frequency when ammonia or nitrite are detectable |
| After overfeeding — extended panel | Nitrate · KH/alkalinity · GH or salinity | Weekly to monthly by system | Use the same method | Reef systems may need calcium, magnesium and phosphate |
| After medication | Ammonia · nitrite · pH · temperature | As needed plus regular schedule | Record results | Increase frequency when ammonia or nitrite are detectable |
| After medication — extended panel | Nitrate · KH/alkalinity · GH or salinity | Weekly to monthly by system | Use the same method | Reef systems may need calcium, magnesium and phosphate |
| Before water change | Ammonia · nitrite · pH · temperature | As needed plus regular schedule | Record results | Increase frequency when ammonia or nitrite are detectable |
| Before water change — extended panel | Nitrate · KH/alkalinity · GH or salinity | Weekly to monthly by system | Use the same method | Reef systems may need calcium, magnesium and phosphate |
| After water change | Ammonia · nitrite · pH · temperature | As needed plus regular schedule | Record results | Increase frequency when ammonia or nitrite are detectable |
| After water change — extended panel | Nitrate · KH/alkalinity · GH or salinity | Weekly to monthly by system | Use the same method | Reef systems may need calcium, magnesium and phosphate |
- • Daily testing is appropriate during startup or whenever ammonia or nitrite are detectable.
- • A stable aquarium still needs routine trend checks.
Download or export
Aquarium Water-Change Response Chart
Plan controlled responses to common water-quality readings without creating a second shock.
Swipe horizontally inside the table to view every column.
| Problem | Response scale | Verify first | Immediate priority | Water-change principle | Avoid |
|---|---|---|---|---|---|
| Detectable ammonia | Small correction | Verify test; protect oxygenation | Reduce feeding temporarily | Small matched changes as needed | Do not raise pH abruptly |
| Detectable ammonia | Moderate correction | Verify test; protect oxygenation | Reduce feeding temporarily | Small matched changes as needed | Do not raise pH abruptly |
| Detectable ammonia | Emergency support | Verify test; protect oxygenation | Reduce feeding temporarily | Small matched changes as needed | Do not raise pH abruptly |
| Detectable nitrite | Small correction | Verify and test source water | Protect biofilter and aeration | Matched partial changes | Do not replace all media |
| Detectable nitrite | Moderate correction | Verify and test source water | Protect biofilter and aeration | Matched partial changes | Do not replace all media |
| Detectable nitrite | Emergency support | Verify and test source water | Protect biofilter and aeration | Matched partial changes | Do not replace all media |
| High nitrate trend | Small correction | Review feeding and stocking | Remove debris | Regular partial changes | Address cause, not only number |
| High nitrate trend | Moderate correction | Review feeding and stocking | Remove debris | Regular partial changes | Address cause, not only number |
| High nitrate trend | Emergency support | Review feeding and stocking | Remove debris | Regular partial changes | Address cause, not only number |
| Low pH with low KH | Small correction | Compare source water | Test alkalinity | Correct slowly | Old-tank syndrome can worsen after abrupt pH rise |
| Low pH with low KH | Moderate correction | Compare source water | Test alkalinity | Correct slowly | Old-tank syndrome can worsen after abrupt pH rise |
| Low pH with low KH | Emergency support | Compare source water | Test alkalinity | Correct slowly | Old-tank syndrome can worsen after abrupt pH rise |
| Salinity high | Small correction | Check evaporation and instrument | Top off with fresh water | Recheck after mixing | Do not add more salt |
| Salinity high | Moderate correction | Check evaporation and instrument | Top off with fresh water | Recheck after mixing | Do not add more salt |
| Salinity high | Emergency support | Check evaporation and instrument | Top off with fresh water | Recheck after mixing | Do not add more salt |
| Salinity low | Small correction | Check leaks and mixing | Prepare matched saltwater | Correct gradually | Do not add dry salt to livestock tank |
| Salinity low | Moderate correction | Check leaks and mixing | Prepare matched saltwater | Correct gradually | Do not add dry salt to livestock tank |
| Salinity low | Emergency support | Check leaks and mixing | Prepare matched saltwater | Correct gradually | Do not add dry salt to livestock tank |
| Temperature mismatch | Small correction | Heat or cool replacement water | Measure before use | Delay large change | Avoid thermal shock |
| Temperature mismatch | Moderate correction | Heat or cool replacement water | Measure before use | Delay large change | Avoid thermal shock |
| Temperature mismatch | Emergency support | Heat or cool replacement water | Measure before use | Delay large change | Avoid thermal shock |
| Chlorine/chloramine | Small correction | Treat replacement water | Verify conditioner use | Do not add untreated water | Chloramine may affect ammonia tests |
| Chlorine/chloramine | Moderate correction | Treat replacement water | Verify conditioner use | Do not add untreated water | Chloramine may affect ammonia tests |
| Chlorine/chloramine | Emergency support | Treat replacement water | Verify conditioner use | Do not add untreated water | Chloramine may affect ammonia tests |
- • Match temperature, pH and salinity as closely as practical.
- • Severe distress requires experienced aquatic-veterinary or professional husbandry support.
Download or export
Aquarium Water-Parameter Troubleshooting Chart
Use combinations and trends to identify what to verify before changing water chemistry.
Swipe horizontally inside the table to view every column.
| Observed pattern | Example | Possible cause | What it may mean | Verify next | Safe response |
|---|---|---|---|---|---|
| Ammonia up; nitrite zero | Pattern 1 | New waste load or early cycle | Biofilter may be undersized | Retest and inspect feeding | Protect oxygenation |
| Ammonia up; nitrite zero | Pattern 2 | New waste load or early cycle | Biofilter may be undersized | Retest and inspect feeding | Protect oxygenation |
| Ammonia up; nitrite zero | Pattern 3 | New waste load or early cycle | Biofilter may be undersized | Retest and inspect feeding | Protect oxygenation |
| Ammonia falling; nitrite rising | Pattern 1 | Cycle is progressing | Nitrite oxidation lags | Continue frequent tests | Do not add livestock |
| Ammonia falling; nitrite rising | Pattern 2 | Cycle is progressing | Nitrite oxidation lags | Continue frequent tests | Do not add livestock |
| Ammonia falling; nitrite rising | Pattern 3 | Cycle is progressing | Nitrite oxidation lags | Continue frequent tests | Do not add livestock |
| Nitrate rising steadily | Pattern 1 | Waste export is below input | Water changes/plant uptake insufficient | Review maintenance | Reduce root cause |
| Nitrate rising steadily | Pattern 2 | Waste export is below input | Water changes/plant uptake insufficient | Review maintenance | Reduce root cause |
| Nitrate rising steadily | Pattern 3 | Waste export is below input | Water changes/plant uptake insufficient | Review maintenance | Reduce root cause |
| pH falling; KH falling | Pattern 1 | Buffer is being consumed | Nitrification produces acid | Test source water and alkalinity | Correct slowly |
| pH falling; KH falling | Pattern 2 | Buffer is being consumed | Nitrification produces acid | Test source water and alkalinity | Correct slowly |
| pH falling; KH falling | Pattern 3 | Buffer is being consumed | Nitrification produces acid | Test source water and alkalinity | Correct slowly |
| pH swings daily | Pattern 1 | CO₂ or low buffering | Photosynthesis/respiration cycle | Measure same times | Avoid chasing each reading |
| pH swings daily | Pattern 2 | CO₂ or low buffering | Photosynthesis/respiration cycle | Measure same times | Avoid chasing each reading |
| pH swings daily | Pattern 3 | CO₂ or low buffering | Photosynthesis/respiration cycle | Measure same times | Avoid chasing each reading |
| Fish gasping; tests normal | Pattern 1 | Oxygen or gill problem possible | Test DO and observe flow | Increase aeration safely | Seek expert help |
| Fish gasping; tests normal | Pattern 2 | Oxygen or gill problem possible | Test DO and observe flow | Increase aeration safely | Seek expert help |
| Fish gasping; tests normal | Pattern 3 | Oxygen or gill problem possible | Test DO and observe flow | Increase aeration safely | Seek expert help |
| Cloudy water after cleaning | Pattern 1 | Bacterial bloom or disturbed debris | Media may be disrupted | Test ammonia/nitrite | Avoid repeated deep cleaning |
| Cloudy water after cleaning | Pattern 2 | Bacterial bloom or disturbed debris | Media may be disrupted | Test ammonia/nitrite | Avoid repeated deep cleaning |
| Cloudy water after cleaning | Pattern 3 | Bacterial bloom or disturbed debris | Media may be disrupted | Test ammonia/nitrite | Avoid repeated deep cleaning |
| Reef alkalinity falls | Pattern 1 | Calcification or dosing mismatch | Consumption exceeds replacement | Confirm test and dosing log | Adjust gradually |
| Reef alkalinity falls | Pattern 2 | Calcification or dosing mismatch | Consumption exceeds replacement | Confirm test and dosing log | Adjust gradually |
| Reef alkalinity falls | Pattern 3 | Calcification or dosing mismatch | Consumption exceeds replacement | Confirm test and dosing log | Adjust gradually |
| Salinity rises | Pattern 1 | Evaporation | Water leaves; salt stays | Top off fresh water | Recalibrate instrument |
| Salinity rises | Pattern 2 | Evaporation | Water leaves; salt stays | Top off fresh water | Recalibrate instrument |
| Salinity rises | Pattern 3 | Evaporation | Water leaves; salt stays | Top off fresh water | Recalibrate instrument |
| All readings suddenly impossible | Pattern 1 | Test or sampling error | Expired reagent or contamination | Repeat with clean equipment | Do not dose from one result |
| All readings suddenly impossible | Pattern 2 | Test or sampling error | Expired reagent or contamination | Repeat with clean equipment | Do not dose from one result |
| All readings suddenly impossible | Pattern 3 | Test or sampling error | Expired reagent or contamination | Repeat with clean equipment | Do not dose from one result |
- • Symptoms can have non-water causes; normal test results do not rule out disease.
- • Never mix aquarium chemicals unless the labels and an experienced professional confirm compatibility.
Download or export
Aquarium Water Parameters Worked Examples
Apply the testing and response principles to common aquarium scenarios.
Swipe horizontally inside the table to view every column.
| Example | System | Reading | Interpretation | First step | Avoid |
|---|---|---|---|---|---|
| Example 1 | Community freshwater | 0.25 mg/L ammonia after new fish | Waste input exceeds current biofilter capacity | Retest; protect aeration; pause new additions | Do not add a second fish |
| Example 2 | Planted tank | 0.5 mg/L nitrite during cycling | Cycle is not fully mature | Continue daily tests and avoid stocking | Do not replace all media |
| Example 3 | Cichlid tank | 60 mg/L nitrate before maintenance | Nitrate export has lagged | Verify; plan matched partial change | Do not perform an unmatched total change |
| Example 4 | Brackish tank | pH down 0.6 with KH near zero | Buffering is depleted or source water changed | Test source water and alkalinity | Do not raise pH suddenly |
| Example 5 | Marine fish-only | salinity 2 ppt above baseline | Evaporation or mixing error likely | Calibrate refractometer and check top-off | Do not add dry salt to the display |
| Example 6 | Reef tank | temperature 3 °C above baseline | Heater, room heat or flow issue | Verify with a second thermometer | Do not add ice directly |
| Example 7 | Community freshwater | 0.25 mg/L ammonia after new fish | Waste input exceeds current biofilter capacity | Retest; protect aeration; pause new additions | Do not add a second fish |
| Example 8 | Planted tank | 0.5 mg/L nitrite during cycling | Cycle is not fully mature | Continue daily tests and avoid stocking | Do not replace all media |
| Example 9 | Cichlid tank | 60 mg/L nitrate before maintenance | Nitrate export has lagged | Verify; plan matched partial change | Do not perform an unmatched total change |
| Example 10 | Brackish tank | pH down 0.6 with KH near zero | Buffering is depleted or source water changed | Test source water and alkalinity | Do not raise pH suddenly |
| Example 11 | Marine fish-only | salinity 2 ppt above baseline | Evaporation or mixing error likely | Calibrate refractometer and check top-off | Do not add dry salt to the display |
| Example 12 | Reef tank | temperature 3 °C above baseline | Heater, room heat or flow issue | Verify with a second thermometer | Do not add ice directly |
| Example 13 | Community freshwater | 0.25 mg/L ammonia after new fish | Waste input exceeds current biofilter capacity | Retest; protect aeration; pause new additions | Do not add a second fish |
| Example 14 | Planted tank | 0.5 mg/L nitrite during cycling | Cycle is not fully mature | Continue daily tests and avoid stocking | Do not replace all media |
| Example 15 | Cichlid tank | 60 mg/L nitrate before maintenance | Nitrate export has lagged | Verify; plan matched partial change | Do not perform an unmatched total change |
| Example 16 | Brackish tank | pH down 0.6 with KH near zero | Buffering is depleted or source water changed | Test source water and alkalinity | Do not raise pH suddenly |
| Example 17 | Marine fish-only | salinity 2 ppt above baseline | Evaporation or mixing error likely | Calibrate refractometer and check top-off | Do not add dry salt to the display |
| Example 18 | Reef tank | temperature 3 °C above baseline | Heater, room heat or flow issue | Verify with a second thermometer | Do not add ice directly |
| Example 19 | Community freshwater | 0.25 mg/L ammonia after new fish | Waste input exceeds current biofilter capacity | Retest; protect aeration; pause new additions | Do not add a second fish |
| Example 20 | Planted tank | 0.5 mg/L nitrite during cycling | Cycle is not fully mature | Continue daily tests and avoid stocking | Do not replace all media |
| Example 21 | Cichlid tank | 60 mg/L nitrate before maintenance | Nitrate export has lagged | Verify; plan matched partial change | Do not perform an unmatched total change |
| Example 22 | Brackish tank | pH down 0.6 with KH near zero | Buffering is depleted or source water changed | Test source water and alkalinity | Do not raise pH suddenly |
| Example 23 | Marine fish-only | salinity 2 ppt above baseline | Evaporation or mixing error likely | Calibrate refractometer and check top-off | Do not add dry salt to the display |
| Example 24 | Reef tank | temperature 3 °C above baseline | Heater, room heat or flow issue | Verify with a second thermometer | Do not add ice directly |
| Example 25 | Community freshwater | 0.25 mg/L ammonia after new fish | Waste input exceeds current biofilter capacity | Retest; protect aeration; pause new additions | Do not add a second fish |
| Example 26 | Planted tank | 0.5 mg/L nitrite during cycling | Cycle is not fully mature | Continue daily tests and avoid stocking | Do not replace all media |
| Example 27 | Cichlid tank | 60 mg/L nitrate before maintenance | Nitrate export has lagged | Verify; plan matched partial change | Do not perform an unmatched total change |
| Example 28 | Brackish tank | pH down 0.6 with KH near zero | Buffering is depleted or source water changed | Test source water and alkalinity | Do not raise pH suddenly |
| Example 29 | Marine fish-only | salinity 2 ppt above baseline | Evaporation or mixing error likely | Calibrate refractometer and check top-off | Do not add dry salt to the display |
| Example 30 | Reef tank | temperature 3 °C above baseline | Heater, room heat or flow issue | Verify with a second thermometer | Do not add ice directly |
- • These examples teach process, not a diagnosis or dosing instruction.
- • Use livestock behavior and repeated measurements alongside test results.
Download or export
Limits and safe interpretation
- • Broad ranges cannot replace species, life-stage and source-water research.
- • Color tests, probes and refractometers require correct storage, calibration and technique.
- • Water numbers do not diagnose parasites, infection, toxins, trauma or organ disease.
- • Avoid abrupt changes in pH, temperature, salinity or hardness.
- • Severe distress, rapid losses or suspected poisoning require experienced aquatic-veterinary or professional help.
Frequently asked questions
What water parameters should I test in an aquarium?
At minimum, test temperature, pH, ammonia, nitrite and nitrate. Add KH, GH, salinity, dissolved oxygen, phosphate, calcium or magnesium when the system requires them.
What should ammonia be in an established aquarium?
Ammonia should not be detectably elevated. Any measurable result should be confirmed and investigated.
What should nitrite be in an aquarium?
Nitrite should not be detectably elevated in an established aquarium.
Is nitrate always dangerous?
Nitrate is less immediately toxic than ammonia or nitrite, but a rising trend signals that waste export is falling behind input.
What is the best aquarium pH?
There is no universal best pH. The correct target matches the livestock and remains stable.
What is the difference between KH and GH?
KH describes buffering or carbonate hardness. GH mainly reflects calcium and magnesium hardness.
Why does ammonia become more dangerous at high pH?
A higher pH shifts more total ammonia into toxic un-ionized NH₃. Warmer water also increases this fraction.
How often should aquarium water be tested?
Test daily during cycling or when ammonia or nitrite are detectable. Stable systems can follow a regular weekly or monthly schedule by parameter.
What salinity should a reef tank use?
A broad planning band is about 34–36 ppt, but stability, calibration and the needs of the actual livestock control the target.
Can I correct pH quickly?
No. Rapid pH changes can be more harmful than a stable value outside a generic range.
Does clear water mean safe water?
No. Ammonia, nitrite, low oxygen and other hazards may be invisible.
Should I replace all filter media when ammonia rises?
No. Replacing all biological media can remove the microbes that process ammonia and nitrite.
Why does aquarium salinity rise?
Evaporation removes water but leaves salt behind. Marine top-off water is normally fresh, not saltwater.
Can this chart diagnose sick fish?
No. Water tests support husbandry assessment but cannot diagnose disease or replace an aquatic veterinarian.
What is the safest way to respond to a surprising result?
Repeat the test, inspect livestock and equipment, protect aeration, compare source water and make gradual matched corrections.
Authoritative sources
Sources are shown as plain text so users can identify and verify the underlying guidance.
Merck Veterinary Manual — Normal Reference Ranges for Routine Water Quality Analysis
Provides aquarium and aquatic-system reference concepts for dissolved oxygen, total ammonia nitrogen, nitrite, nitrate, pH, alkalinity, hardness and salinity-related testing.
https://www.merckvetmanual.com/multimedia/table/normal-reference-ranges-for-routine-water-quality-analysis
Merck Veterinary Manual — Routine Health Care of Fish
Recommends routine water testing, partial water changes, filter maintenance and parameter tracking for freshwater, brackish and saltwater aquariums.
https://www.merckvetmanual.com/all-other-pets/fish/routine-health-care-of-fish
New Mexico State University Cooperative Extension — Important Water Quality Parameters in Aquaponics Systems
Explains interactions among dissolved oxygen, ammonia, nitrite, nitrate, pH, temperature, hardness, alkalinity, biofiltration and testing frequency.
https://pubs.nmsu.edu/_circulars/CR680/