Health & Medical · Age-based body-size reference
BMI by Age Chart for Babies, Children, Teens, Adults, and Seniors
Compare infant growth methods, child and teen BMI percentiles, adult body mass index ranges, older-adult limitations, accurate measurement steps, and the age transitions that change how one BMI result should be read.
BMI is a screening measure, not a diagnosis. Age selects the correct reference, but muscle, growth, pregnancy, waist size, illness, medicines, nutrition, and weight direction still matter. Read the ChartsLoom Disclaimer.
What is a healthy BMI by age?
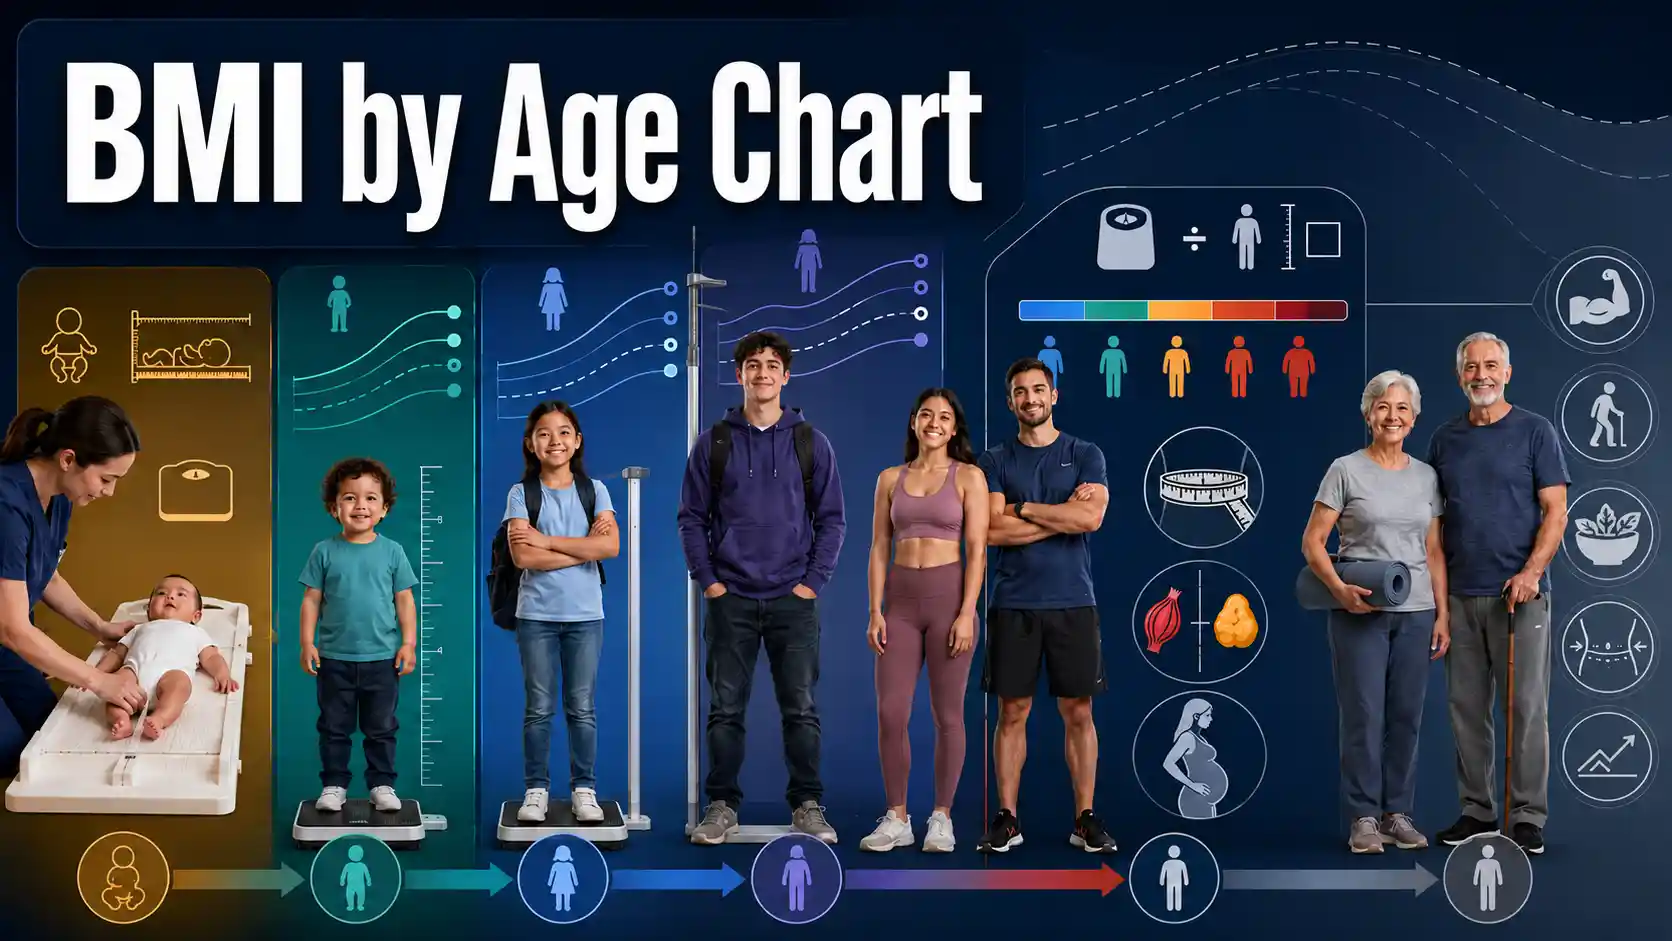
Before age 2, use weight-for-length instead of routine BMI classification. From ages 2–19, use sex- and age-specific BMI percentiles. At age 20 and older, use fixed adult BMI ranges.
The CDC child and teen BMI categories define healthy weight as the 5th percentile to below the 85th percentile for ages 2–19. The CDC adult BMI categories define the standard healthy-weight range as 18.5 to below 25 from age 20 onward.
- Birth to under 2
- Use weight-for-length
- Ages 2–19
- Use BMI percentiles
- Age 20 and older
- Use adult ranges
- Older adulthood
- Check muscle and trend
Routine BMI-for-age interpretation is not recommended for infants and young toddlers.
The result depends on exact age and sex, not adult numerical cutoffs.
The same adult cutoffs apply across adulthood, while health context changes interpretation.
Frailty, low muscle, edema, height loss, and unintentional weight change can make BMI misleading.
There is no evidence-based adult “ideal BMI by decade” chart
Adult category cutoffs do not rise at ages 30, 40, 50, 60, or 70. Aging changes muscle, fat distribution, height, appetite, function, and illness risk, so the same category may need different clinical context—not a different mathematical cutoff.
Use the broader BMI Chart for formulas, adult height-to-weight ranges, waist measurements, pregnancy weight-gain context, and general BMI limitations.
BMI interpretation by age and life stage
Age changes which growth indicator or BMI category system should be used. Infants use weight-for-length, children and teens use BMI-for-age percentiles, and adults use fixed BMI ranges.
Swipe horizontally inside the table to view every column.
| Age or life stage | Primary measure | How results are classified | Important interpretation point |
|---|---|---|---|
| Birth to younger than 2 years | Weight-for-length, length-for-age, and weight-for-age — BMI not recommended for routine infant interpretation | Use WHO growth-standard percentiles selected for sex and age. BMI-for-age is not recommended for routine interpretation. | Recumbent length differs from standing height, and infant BMI has limited evidence for clinical meaning. |
| Ages 2–5 | BMI-for-age percentile | Compare calculated BMI with children of the same sex and age on CDC growth charts. | The transition at age 2 changes both the measurement method and the reference chart, so percentile shifts need cautious interpretation. |
| Ages 6–11 | BMI-for-age percentile | Underweight is below the 5th percentile; healthy weight is the 5th to below the 85th percentile. | Growth velocity, puberty timing, medicines, nutrition, and family history can change the clinical meaning of one percentile. |
| Ages 12–19 | BMI-for-age percentile | Continue age- and sex-specific percentiles through age 19. | Adult BMI cutoffs should not replace pediatric percentiles before age 20. |
| Ages 20–64 | Adult BMI | Use fixed adult ranges regardless of age or sex. — Adult categories begin at age 20 | BMI screens weight relative to height but does not directly measure body fat, muscle, fitness, or metabolic health. |
| Age 65 and older | Adult BMI plus nutrition, strength, and function assessment | The standard adult categories still apply. | Muscle loss, frailty, edema, height loss, and unintentional weight change can make the same BMI more difficult to interpret. |
| Pregnancy | Prepregnancy BMI and pregnancy weight-gain guidance | Use BMI calculated before pregnancy or early in pregnancy to select a weight-gain range. | Do not classify later-pregnancy weight with the ordinary adult BMI chart because fetal, placental, and fluid weight are expected. |
| Athletes and highly muscular adults | Adult BMI plus body-composition and waist context | Adult categories apply mathematically, but BMI may overstate body fat. | Muscle mass, performance, waist measurement, blood pressure, glucose, and lipids add important context. |
BMI is measured in kilograms per square meter, written kg/m².
- • Age determines the correct interpretation method; it does not change the BMI formula itself.
- • A chart is a screening reference and cannot diagnose malnutrition, obesity-related disease, or healthy body composition by itself.
Download or export
How BMI interpretation changes with age
The BMI formula stays the same, but the correct reference changes at age 2 and again at age 20.
Birth–<2 years
Weight-for-length
Use WHO infant growth standards. Routine BMI-for-age interpretation is not recommended.
2–5 years
BMI percentile begins
Switch to standing height and CDC BMI-for-age percentiles. Interpret transition changes cautiously.
6–11 years
Growth-chart tracking
Use exact age, sex, height, and weight. Follow the percentile pattern over time.
12–19 years
Teen percentiles
Continue pediatric BMI-for-age categories through age 19, including extended charts for very high BMI.
20+ years
Adult ranges
Use fixed adult BMI categories. Older age adds context but does not create higher normal cutoffs.
The same raw BMI can receive a different age-based interpretation
Pediatric BMI needs an age- and sex-specific percentile. Adult BMI uses fixed numerical cutoffs.
9-year-old boy
BMI 15.2
CDC example: about 28th percentile
Adult
BMI 15.2
Underweight range
12-year-old girl
BMI 26.6
CDC example: about 96th percentile
Adult
BMI 26.6
Overweight range
Data-table fallback: BMI 15.2 is a healthy-weight pediatric example for a 9-year-old boy but is underweight for an adult. BMI 26.6 is a pediatric obesity example for a 12-year-old girl but is adult overweight.
BMI by age calculator and context checker
Calculate raw BMI, then apply the correct age pathway. Ages 2–19 need a percentile from the CDC growth chart; adults age 20 and older use fixed categories.
Pediatric obesity category
The entered BMI percentile is 96.0, at or above the 95th percentile. The raw BMI is 26.6.
Use the exact percentile or extended BMI chart to assess severity and arrange a complete pediatric evaluation.
This checker runs in your browser and does not transmit entered measurements. It calculates BMI but does not diagnose a health condition or calculate a pediatric percentile.
Children need a percentile because bodies change during growth
A child’s raw BMI is plotted against children of the same sex and exact age. The CDC plotting and interpretation guidance explains how percentiles describe relative position in the reference population and why a series of accurate measurements matters more than one point.
For babies and young toddlers, use the Baby Growth Percentile Chart to compare weight, length, and head circumference rather than applying child or adult BMI cutoffs.
BMI-for-age categories for children and teens
For ages 2 through 19, the calculated BMI must be converted to an age- and sex-specific percentile before assigning a category.
Swipe horizontally inside the table to view every column.
| Category | BMI-for-age percentile or threshold | What the percentile means | Next step |
|---|---|---|---|
| Underweight | Below the 5th percentile | The BMI is lower than at least 95% of the same-age, same-sex reference group. | Confirm height and weight accuracy and review growth direction, nutrition, symptoms, and health history. |
| Healthy weight — Healthy-weight percentile range | 5th percentile to below the 85th percentile | The BMI falls within the broad central reference range. | Continue routine growth monitoring; a percentile alone does not prove adequate nutrition or metabolic health. |
| Overweight | 85th percentile to below the 95th percentile | The BMI is higher than most of the reference group but below the obesity threshold. | Review the trend, family history, sleep, activity, nutrition, blood pressure, and other risk factors without using stigmatizing language. |
| Obesity | 95th percentile or greater | The BMI reaches the age- and sex-specific obesity threshold. | Use a complete clinical assessment and evidence-based, family-centered care rather than focusing on one number alone. |
| Severe obesity | 120% of the 95th percentile or greater, or BMI 35 kg/m² or greater — Severe obesity threshold | The value reaches a high-BMI threshold that requires extended chart methods. | Use the CDC extended BMI-for-age charts and prompt professional assessment for related health risks. |
| Class 2 obesity | 120% to below 140% of the 95th percentile, or BMI 35 to below 40 kg/m² | The value is within the lower severe-obesity class. | Assessment may include blood pressure, glucose, lipids, liver health, sleep, mental health, and treatment options. |
| Class 3 obesity | 140% of the 95th percentile or greater, or BMI 40 kg/m² or greater | The value reaches the higher severe-obesity class. | A pediatric obesity specialist or multidisciplinary team may be appropriate, depending on age and clinical needs. |
Percentiles compare a child with the CDC reference population of the same sex and age.
- • A 75th percentile result does not mean 75% body fat. It means the BMI equals or exceeds about 75% of the reference group.
- • For very high BMI values, use extended BMI-for-age methods rather than extrapolating ordinary percentile curves.
Download or export
Very high pediatric BMI needs extended growth-chart methods
The ordinary 2000 BMI-for-age charts become compressed above the upper percentile curves. The CDC extended BMI-for-age charts provide a better method for tracking very high BMI values and change over time.
Adult BMI categories from age 20 onward
The standard adult BMI ranges apply at age 20 and older. The numerical cutoffs do not increase by decade, although interpretation becomes more individualized with aging and health changes.
Swipe horizontally inside the table to view every column.
| Adult BMI category | BMI range | Does age change the cutoff? | Interpretation |
|---|---|---|---|
| Underweight | Below 18.5 | No | Review recent weight change, food intake, gastrointestinal symptoms, medicines, muscle loss, and possible illness. |
| Healthy weight | 18.5 to below 25.0 — Standard adult healthy-weight range | No | This is the standard reference range, but waist size, muscle, fitness, blood pressure, glucose, lipids, and symptoms still matter. |
| Overweight | 25.0 to below 30.0 | No | BMI alone cannot show whether the extra weight is muscle, central fat, fluid, or another body-composition pattern. |
| Obesity class 1 | 30.0 to below 35.0 | No | Use a respectful, person-centered assessment of related health risks and treatment preferences. |
| Obesity class 2 | 35.0 to below 40.0 | No | Clinical evaluation may include cardiometabolic, liver, joint, sleep, reproductive, and medication considerations. |
| Obesity class 3 | 40.0 or greater — Class 3 obesity range | No | The category indicates severe obesity, but treatment intensity and goals should reflect the person’s health, function, and preferences. |
Adult BMI is expressed in kg/m².
- • Adult categories apply regardless of age, sex, or race in the CDC framework.
- • The same BMI may have different health implications in a muscular young adult, a person with central adiposity, and an older adult with low muscle mass.
Download or export
Why the same BMI can mean different things at different ages
A raw BMI number cannot be interpreted without age. Pediatric results need percentiles, while adult results use fixed ranges.
Swipe horizontally inside the table to view every column.
| Person or example | Raw BMI | Age-based interpretation | Key lesson |
|---|---|---|---|
| Infant younger than 2 | Any calculated BMI | Do not use routine BMI-for-age classification; use WHO weight-for-length and other infant growth measures. | The formula can be calculated, but the result is not the recommended routine growth indicator. |
| CDC example: 9-year-old boy | 15.2 | Approximately the 28th BMI-for-age percentile in the CDC example, within the healthy-weight category. — Healthy pediatric example | A raw BMI that would be underweight for an adult can be healthy for a growing child. |
| CDC example: 12-year-old girl | 26.6 | Approximately the 96th BMI-for-age percentile in the CDC example, within the obesity category. — Pediatric obesity example | The child category comes from age and sex, not from adult cutoffs. |
| Adult age 20 or older | 15.2 | Underweight because the adult BMI is below 18.5. | Adult classification begins at age 20. |
| Adult age 20 or older | 26.6 | Overweight because the adult BMI is 25.0 to below 30.0. | The same raw value that reaches pediatric obesity in one example is adult overweight. |
| Older adult | 22.0 | Within the standard adult healthy-weight range. | Unintentional loss, low strength, frailty, and poor intake can still make this result clinically concerning. |
BMI values are in kg/m². Pediatric percentiles depend on precise age and sex.
- • The pediatric examples are educational examples published in CDC growth-chart training and BMI-category materials.
- • Do not estimate a child’s percentile from this example table; calculate it with the correct growth-chart method.
Download or export
Why BMI is not the routine growth measure before age 2
The CDC guidance for WHO infant growth standards recommends weight-for-length, length-for-age, weight-for-age, and head circumference for children from birth to age 2. Infant BMI uses recumbent length, and evidence about its routine meaning is limited.
BMI chart transitions at age 2 and age 20
Two age boundaries change the interpretation system: the move from infant weight-for-length to BMI-for-age at age 2, and the move from pediatric percentiles to adult BMI categories at age 20.
Swipe horizontally inside the table to view every column.
| Transition | What changes | What can look different | How to handle it |
|---|---|---|---|
| Approaching age 2 | The child is usually measured lying down and plotted on WHO infant charts. | Length, weight-for-length percentile, and body proportions reflect infant measurement methods. | Use accurate recumbent length and review the pattern over time. |
| At age 2 — Transition to BMI-for-age | Standing height replaces recumbent length, and CDC BMI-for-age charts replace WHO weight-for-length charts. | Standing height is typically slightly shorter than recumbent length, so the calculated BMI and percentile can shift. | Do not assume a percentile change represents sudden true growth change. Confirm technique and follow the trend. |
| Ages 2–19 | BMI is converted to a sex- and age-specific percentile. | The same raw BMI can move across percentile curves as age and puberty change. | Plot exact age, sex, height, and weight on the correct CDC chart. |
| At age 20 — Transition to adult BMI | Pediatric percentiles stop and fixed adult ranges begin. | A person can receive a different category even when weight and height have not changed. | Use adult categories from age 20 onward and explain the method change clearly. |
| After age 20 | Adult numerical cutoffs remain fixed. | Body composition, muscle, waist size, pregnancy, edema, aging, and illness can alter the clinical meaning. | Use BMI beside other measurements rather than creating decade-specific “normal” cutoffs. |
Age refers to completed chronological age. Corrected age may be used for some premature infants under professional guidance.
- • The biggest chart-method changes occur at age 2 and age 20.
- • Growth monitoring depends on a series of accurate measurements rather than one isolated category.
Download or export
How to measure height and weight accurately by age
Small measurement errors can change BMI, and pediatric percentiles can be especially sensitive near category boundaries.
Swipe horizontally inside the table to view every column.
| Age or situation | Height or length method | Weight method | Common error to avoid |
|---|---|---|---|
| Birth to younger than 2 | Measure recumbent length on a length board with two trained people when possible. — Recumbent length required | Use a calibrated infant scale with minimal clothing and no diaper when the protocol requires it. | Do not substitute standing height or a household adult scale for clinical growth assessment. |
| Ages 2–5 | Measure standing height without shoes, heels together, and head positioned correctly. | Use a calibrated scale with light clothing. | Do not mix recumbent length and standing height without noting the method change. |
| School-age child | Stand straight against a stadiometer with shoes removed. | Measure on a level, calibrated scale. | Do not rely on a self-reported height during rapid growth. |
| Teenager | Use the same standing-height protocol and record exact age. | Use consistent clothing and scale conditions. | Do not apply adult cutoffs before age 20. |
| Adult | Measure without shoes and account for posture or spinal curvature. | Use a reliable scale on a hard level surface. | Do not round height heavily before squaring it in the formula. |
| Older adult | Review height loss, kyphosis, inability to stand, and alternative measures when needed. | Assess recent and usual weight, not only today’s number. | Do not ignore edema, dehydration, amputation, or unintentional change. — Older adult limitations |
| Home tracking | Use the same technique and time of day when practical. | Use the same scale and similar clothing. | Do not react to one small daily change; look for a sustained pattern. |
Metric formula: kg ÷ m². U.S. formula: 703 × lb ÷ in².
- • A BMI calculator is only as accurate as the entered height and weight.
- • Clinicians may use alternative anthropometric methods when standing height or ordinary weight cannot be measured reliably.
Download or export
Accurate height matters because the formula squares it
Shoes, posture, recumbent versus standing measurement, heavy clothing, a soft floor under the scale, and rounding can change BMI. Near a percentile or category boundary, repeat the measurements before interpreting the result.
BMI interpretation considerations for older adults
The standard adult ranges continue after age 65, but age-related muscle loss, height loss, illness, and function can make BMI less informative on its own.
Swipe horizontally inside the table to view every column.
| Issue | How it can affect BMI | What else to review | Why it matters |
|---|---|---|---|
| Sarcopenia or low muscle mass | BMI can remain in the healthy or overweight range despite low muscle and strength. | Grip strength, walking speed, resistance activity, protein intake, and body composition when available. | Low muscle can increase falls, frailty, and loss of independence even without a low BMI. |
| Unintentional weight loss | BMI may still look normal after clinically important loss. — Unintentional loss can be hidden by category | Percentage weight change, appetite, swallowing, dental health, mood, medications, and illness. | The direction and speed of change can matter more than the current category. |
| Height loss or spinal curvature | Using an old height can understate BMI; inaccurate current height can distort the result. | Current measured height, arm span, knee height, or clinician-selected alternatives. | Age-related posture changes make ordinary standing height less reliable for some people. |
| Edema or fluid retention | Extra fluid raises body weight without representing fat or muscle gain. — Fluid can distort body weight | Swelling, heart or kidney status, medicines, and dry-weight estimates. | Rapid fluid change can make BMI misleading. |
| Frailty and poor intake | A lower BMI may accompany inadequate energy, protein, and micronutrient intake. | Function, fatigue, food access, gastrointestinal symptoms, and nutrition screening. | Preventing further loss and preserving strength may be a higher priority than pursuing a population BMI target. |
| Central adiposity | BMI may not show where body fat is stored. | Waist circumference, waist-to-height ratio, blood pressure, glucose, and lipids. | Abdominal fat can increase cardiometabolic risk at the same BMI. |
| Multiple conditions or medicines | Illness and treatment can alter appetite, fluid, activity, and body composition. | Medication review, kidney and liver function, mobility, cognition, and goals of care. | Management should be individualized rather than based on BMI alone. |
The adult BMI cutoffs remain unchanged; this table describes interpretation, not alternative diagnostic categories.
- • Older adults should not be assigned a new “normal BMI by decade” without an evidence-based clinical framework.
- • Report unexplained weight loss, weakness, appetite loss, swelling, or reduced function to a healthcare professional.
Download or export
Unintentional weight loss can matter at any BMI
A person can remain inside the healthy or overweight range while losing substantial muscle or body weight. Report unexplained loss, appetite decline, weakness, swallowing difficulty, swelling, falls, or reduced function instead of waiting for BMI to cross a category boundary.
Practical follow-up after a BMI result by age
The next step depends on age, growth pattern, symptoms, category, and whether the weight change is intentional.
Swipe horizontally inside the table to view every column.
| Age or result | Useful first step | Measurements or questions to add | When to seek prompt help |
|---|---|---|---|
| Infant younger than 2 | Use weight-for-length and the full infant growth pattern with a pediatric professional. | Feeding, wet diapers, vomiting, stool pattern, development, length, weight, and head circumference. | Poor feeding, dehydration signs, repeated vomiting, breathing difficulty, lethargy, or rapid percentile crossing. — Infant warning signs |
| Child or teen below the 5th percentile | Confirm measurements and review the trajectory rather than assuming the child needs simple calorie advice. | Dietary intake, gastrointestinal symptoms, puberty, chronic illness, medicines, food security, and activity. | Rapid loss, fainting, dehydration, eating-disorder signs, severe weakness, or delayed growth. |
| Child or teen at or above the 85th percentile | Use supportive, family-centered assessment without blame or crash dieting. | Sleep, activity, nutrition, mental health, blood pressure, glucose, lipids, liver health, and family history. | Breathing problems, severe headaches, symptoms of high glucose, or other acute illness. |
| Adult below 18.5 | Review whether the value is usual, intentional, stable, or falling. | Recent weight change, appetite, digestion, dental health, mood, strength, and medical conditions. | Rapid unexplained loss, inability to eat or drink, fainting, blood loss, or severe weakness. |
| Adult 18.5–24.9 | Use BMI as one screening result, not a guarantee of health. | Waist size, blood pressure, glucose, lipids, fitness, sleep, smoking, alcohol, and family history. | Symptoms or abnormal related measurements still require assessment. |
| Adult 25 or higher | Discuss health goals, preferences, and evidence-based options rather than focusing only on a target weight. | Waist size, metabolic markers, sleep apnea, joint symptoms, medicines, and previous treatment response. | Chest pain, severe breathlessness, neurologic symptoms, or another emergency symptom. |
| Older adult with change at any BMI — Older adult change deserves context | Prioritize the direction of weight, strength, appetite, and function. | Falls, walking, grip strength, swelling, food access, cognition, and medication effects. | Rapid unintentional loss, dehydration, new edema, confusion, or marked functional decline. |
This is educational follow-up guidance, not a diagnosis or individualized treatment plan.
- • Use person-first, non-stigmatizing language when discussing weight and body size.
- • Children should not start restrictive diets or weight-loss medicines without appropriate pediatric assessment.
Download or export
Frequently asked questions
Does normal BMI change with age?
The interpretation method changes with age. Children ages 2–19 use BMI-for-age percentiles, while adults age 20 and older use fixed BMI categories. Adult cutoffs do not rise by decade.
What BMI should a 2-year-old have?
There is no single healthy raw BMI for every 2-year-old. At age 2, BMI must be converted to a sex- and age-specific percentile on the CDC growth chart.
Should babies have BMI calculated?
BMI can be calculated mathematically, but CDC guidance does not recommend BMI-for-age for routine interpretation before age 2. Clinicians use WHO weight-for-length and other infant growth measures.
What is a healthy BMI percentile for children?
The CDC healthy-weight category is the 5th percentile to below the 85th percentile for children and teens ages 2–19.
When do adult BMI ranges start?
CDC adult BMI categories begin at age 20. People ages 2–19 should continue using BMI-for-age percentiles.
Is a BMI of 25 normal for an older adult?
A BMI of 25 begins the standard adult overweight category at every adult age. In older adults, muscle, frailty, appetite, weight change, waist size, and function can be more informative than the category alone.
Why can the same BMI be healthy for a child but low for an adult?
Children grow and change body proportions with age, so their BMI is ranked against peers of the same age and sex. Adults use fixed numerical cutoffs.
Can I use an adult BMI calculator for a teenager?
No. A teenager should use a child and teen BMI calculator that produces an age- and sex-specific percentile through age 19.
What is severe obesity in children?
CDC defines severe obesity as 120% of the age- and sex-specific 95th percentile or greater, or BMI 35 kg/m² or greater. Extended growth charts are used for very high values.
Does puberty affect BMI percentile?
Puberty changes height, weight, muscle, and fat distribution. BMI-for-age charts account for typical age and sex patterns, but puberty timing and growth direction still need clinical context.
Why might BMI be misleading after age 65?
BMI can hide low muscle mass, frailty, central fat, edema, and important unintentional weight loss. Strength, function, waist size, appetite, and weight trend add context.
How often should children have BMI checked?
CDC growth-chart training supports annual BMI screening from age 2, with additional assessment when growth, symptoms, medicines, or health risks require it.
Does pregnancy change the BMI formula?
The formula does not change, but later-pregnancy weight should not be classified with the ordinary adult BMI chart. Prepregnancy BMI is used to select pregnancy weight-gain guidance.
Can BMI diagnose obesity-related disease?
No. BMI is a screening measure. Diagnosis and treatment decisions require other information such as body composition, waist size, blood pressure, glucose, lipids, symptoms, and health history.
Sources
These references support the age boundaries, infant growth methods, pediatric percentiles, adult categories, example interpretations, and extended pediatric charts used on this page.
Centers for Disease Control and Prevention
Adult BMI Categories
https://www.cdc.gov/bmi/adult-calculator/bmi-categories.html
Adult BMI categories for people age 20 and older, including underweight, healthy weight, overweight, and obesity classes.
Centers for Disease Control and Prevention
Child and Teen BMI Categories
https://www.cdc.gov/bmi/child-teen-calculator/bmi-categories.html
BMI-for-age percentile categories for children and adolescents ages 2 through 19, including severe obesity definitions.
Centers for Disease Control and Prevention
Using WHO Growth Standard Charts
https://www.cdc.gov/growth-chart-training/hcp/using-growth-charts/who-using.html
Guidance to use weight-for-length rather than BMI-for-age for children younger than 2 years and to transition to CDC charts at age 2.
Centers for Disease Control and Prevention
Plotting and Interpreting BMI-for-Age
https://www.cdc.gov/growth-chart-training/hcp/using-bmi/plotting-interpreting-bmi.html
How clinicians calculate BMI, plot age- and sex-specific percentiles, interpret trends, and use extended charts for very high BMI.
Centers for Disease Control and Prevention
CDC Extended BMI-for-Age Growth Charts
https://www.cdc.gov/growthcharts/extended-bmi.htm
Extended pediatric BMI-for-age charts and methods for tracking values above the 97th percentile.
Match the BMI result to the correct age system
Use weight-for-length before age 2, BMI-for-age percentiles from ages 2–19, and fixed adult ranges from age 20 onward. Then add growth direction, body composition, waist size, nutrition, symptoms, function, pregnancy, and related health measurements before deciding what the number means.