Health & Medical
BMI Chart
Use this BMI chart to compare adult body mass index ranges, calculate BMI in metric or U.S. units, find approximate weight ranges by height, and understand when age, waist size, pregnancy, muscle, or health history changes the interpretation.
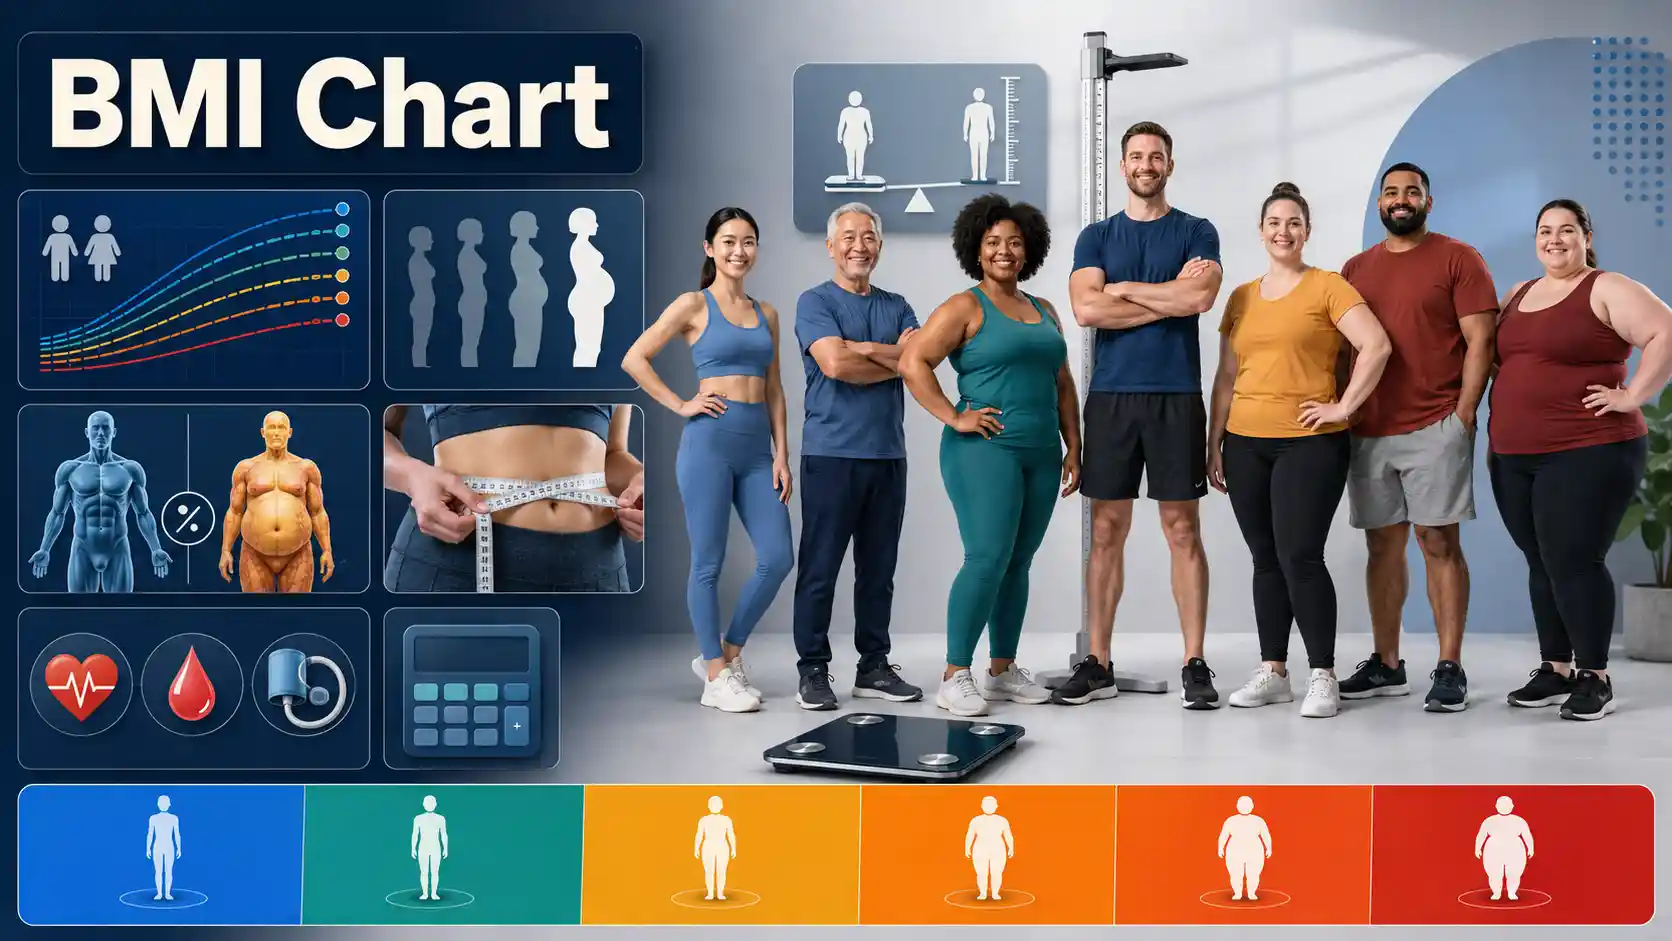
Short answer
BMI compares body weight with height. The metric formula is weight in kilograms divided by height in meters squared.
For most adults age 20 and older, 18.5 to 24.9 is the standard healthy-weight range, 25.0 to 29.9 is overweight, and 30.0 or higher is obesity.
Children and teens do not use adult cutoffs. Their BMI must be converted to an age- and sex-specific percentile.
What BMI tells you—and what it does not
BMI is a fast screening measure of weight relative to height. It can flag a result that deserves more context, but it cannot separate fat from muscle, show where fat is stored, diagnose malnutrition, or prove that a person has an obesity-related disease.
The standard adult ranges on this page follow the CDC adult BMI categories. Use the result beside other health attributes such as waist size, blood pressure, glucose, lipids, fitness, symptoms, medicines, and weight change over time.
BMI can add context to the Blood Pressure Chart, the Blood Sugar Levels Chart, and the A1C Chart. None of those measurements should be interpreted in isolation.
Adult BMI chart and classification ranges
Adult BMI categories begin at age 20 in the CDC framework. The same standard numerical cutoffs apply across adult age and sex groups, although individual interpretation can change with muscle mass, frailty, body-fat distribution, health conditions, and ethnicity-related cardiometabolic risk.
Adult BMI categories and ranges
These screening categories apply to most adults age 20 and older. BMI uses kilograms per square meter, written as kg/m².
| BMI category | BMI range | What the range means |
|---|---|---|
| Underweight | Below 18.5 | Weight is low relative to height; health context and unplanned weight loss matter. |
| Healthy weight | 18.5 to 24.9 | This is the standard adult reference range, but it does not guarantee low health risk. |
| Overweight | 25.0 to 29.9 | Weight is above the standard healthy range; waist size and other risk markers add context. |
| Obesity, class 1 | 30.0 to 34.9 | BMI meets the first obesity class. |
| Obesity, class 2 | 35.0 to 39.9 | BMI meets the second obesity class. |
| Obesity, class 3 | 40.0 or higher | BMI meets the severe obesity category. |
| Any category | No single cutoff | Clinical interpretation also considers blood pressure, glucose, lipids, fitness, medicines, and symptoms. |
Notes
- • Adult categories do not increase automatically with age and do not differ by sex in the standard CDC framework.
- • BMI is a screening measure, not a diagnosis of body fat or health status.
Sources
- CDC Adult BMI Categories
Adult BMI range visual
The scale applies to adults age 20 and older. The category is a starting point for interpretation, not a complete health assessment.
Underweight
Below 18.5
Review weight history, nutrition, and symptoms.
Healthy weight
18.5–24.9
Standard adult reference range.
Overweight
25.0–29.9
Add waist and metabolic-risk context.
Obesity class 1
30.0–34.9
Comprehensive risk assessment can help.
Obesity class 2
35.0–39.9
Health effects and treatment needs vary.
Obesity class 3
40 or higher
This is the severe obesity category.
A direct answer
A BMI of 18.5 to 24.9 is the standard healthy-weight range for most adults. A result outside that range does not diagnose a disease, and a result inside it does not rule one out.
Interactive calculator
Calculate BMI in metric or U.S. units
Enter measured height and weight. The calculation runs in your browser and does not transmit the values. Adult categories apply from age 20; ages 2 through 19 need BMI-for-age percentiles.
Calculated result
22.9
kg/m²
Healthy weight
Approximate standard healthy-weight interval for this height
56.7–76.3 kg or 125–168 lb
How BMI is calculated
BMI rises with weight and falls as height increases. Because height is squared, unit errors can change the answer sharply. Measure height without shoes, use a reliable scale, and round only after completing the formula.
BMI formulas and worked examples
Metric and U.S. customary calculations produce the same body mass index when the units are entered correctly.
| Measurement system | Formula | Worked example | Result |
|---|---|---|---|
| Metric | weight in kg ÷ height in meters² | 70 kg ÷ (1.75 m × 1.75 m) | BMI 22.9 |
| U.S. customary | 703 × weight in lb ÷ height in inches² | 703 × 170 lb ÷ (70 in × 70 in) | BMI 24.4 |
| Kilograms from pounds | pounds ÷ 2.2046 | 170 lb ÷ 2.2046 | 77.1 kg |
| Meters from centimeters | centimeters ÷ 100 | 175 cm ÷ 100 | 1.75 m |
Notes
- • Round the final BMI to one decimal place after completing the calculation.
Sources
- CDC Adult BMI Calculator
- NHLBI BMI Calculator
BMI chart by height and weight
A BMI-by-height chart reverses the formula: it shows which approximate weights correspond to the adult thresholds at a given height. The healthy-weight interval is a mathematical reference, not a required appearance or personal treatment goal.
Healthy BMI weight range by height
This lookup converts BMI thresholds into approximate body weights. Rounding can shift a boundary by about one pound or one kilogram.
| Height | Approximate healthy-weight range | Overweight begins near | Obesity begins near |
|---|---|---|---|
| 4 ft 10 in (147 cm) | 89–119 lb (40.2–54.2 kg) | 120 lb (54.3 kg) | 144 lb (65.2 kg) |
| 5 ft 0 in (152 cm) | 95–128 lb (43.0–58.0 kg) | 129 lb (58.1 kg) | 154 lb (69.7 kg) |
| 5 ft 2 in (157 cm) | 102–136 lb (45.9–61.9 kg) | 137 lb (62.0 kg) | 165 lb (74.4 kg) |
| 5 ft 4 in (163 cm) | 108–145 lb (48.9–66.0 kg) | 146 lb (66.1 kg) | 175 lb (79.3 kg) |
| 5 ft 6 in (168 cm) | 115–154 lb (52.0–70.2 kg) | 155 lb (70.3 kg) | 186 lb (84.4 kg) |
| 5 ft 8 in (173 cm) | 122–164 lb (55.2–74.5 kg) | 165 lb (74.6 kg) | 198 lb (89.5 kg) |
| 5 ft 10 in (178 cm) | 129–174 lb (58.5–79.0 kg) | 175 lb (79.1 kg) | 210 lb (94.9 kg) |
| 6 ft 0 in (183 cm) | 137–184 lb (61.9–83.6 kg) | 185 lb (83.7 kg) | 222 lb (100.4 kg) |
| 6 ft 2 in (188 cm) | 145–194 lb (65.4–88.3 kg) | 195 lb (88.4 kg) | 234 lb (106.0 kg) |
| 6 ft 4 in (193 cm) | 152–205 lb (69.0–93.1 kg) | 206 lb (93.2 kg) | 247 lb (111.8 kg) |
| 6 ft 6 in (198 cm) | 161–216 lb (72.7–98.1 kg) | 217 lb (98.2 kg) | 260 lb (117.8 kg) |
Notes
- • The healthy-weight column represents BMI 18.5 through 24.9 for adults.
- • Use measured height without shoes and a reliable scale for a more accurate result.
Sources
- Calculated from CDC adult BMI thresholds
BMI chart for children and teenagers
Growth changes the meaning of BMI. For ages 2 through 19, clinicians calculate raw BMI and then plot it against others of the same age and sex. The CDC child and teen BMI categories use percentiles rather than adult numerical cutoffs.
A child in the 75th BMI percentile has a BMI equal to or higher than about 75% of the reference group of the same age and sex. It does not mean the child has 75% body fat. Growth direction, puberty, family pattern, nutrition, health conditions, and measurement accuracy all matter. For younger children, compare this topic with the Baby Growth Percentile Chart.
Child and teen BMI-for-age categories
For ages 2 through 19, a raw BMI must be compared with sex-specific BMI-for-age growth charts. Adult cutoffs should not be applied directly.
| Category | BMI-for-age definition | Interpretation |
|---|---|---|
| Underweight | Below the 5th percentile | BMI is lower than most peers of the same age and sex. |
| Healthy weight | 5th percentile to below the 85th percentile | BMI falls within the central reference range. |
| Overweight | 85th percentile to below the 95th percentile | BMI is elevated for age and sex. |
| Obesity | 95th percentile or higher | BMI meets the obesity screening category. |
| Severe obesity | At least 120% of the 95th percentile, or BMI at least 35 | This is a subset of obesity that needs careful clinical assessment. |
| Age younger than 2 | BMI-for-age is not the standard measure | Clinicians generally use weight-for-length and infant growth standards. |
Notes
- • A percentile compares a child with a reference population of the same age and sex; it is not the percentage of body fat.
- • Growth direction over time matters more than one isolated percentile.
Sources
- CDC Child and Teen BMI Categories
Why some adults use lower BMI action thresholds
Cardiometabolic risk does not begin at one universal body size. The NICE obesity and central-adiposity guidance uses lower practical thresholds for South Asian, Chinese, other Asian, Middle Eastern, Black African, and African-Caribbean backgrounds because central adiposity and related risk can occur at lower BMI values.
These cutoffs guide screening and earlier risk review. They do not replace personal history, waist-to-height ratio, laboratory results, or clinical judgment.
When lower adult BMI thresholds may be used
Some clinical systems use lower action thresholds for populations that can develop central adiposity and cardiometabolic risk at a lower BMI.
| Interpretation framework | Overweight range | Obesity begins | Important context |
|---|---|---|---|
| Standard adult categories | 25.0 to 29.9 | 30.0 | Common CDC adult screening categories. |
| NICE lower-risk thresholds | 23.0 to 27.4 | 27.5 | Applied to South Asian, Chinese, other Asian, Middle Eastern, Black African, and African-Caribbean backgrounds. |
| NICE obesity class 2 context | Not applicable | 32.5 | The standard class 2 threshold is reduced by 2.5 BMI units. |
| NICE obesity class 3 context | Not applicable | 37.5 | The standard class 3 threshold is reduced by 2.5 BMI units. |
Notes
- • These lower thresholds are practical risk-screening cutoffs, not statements about identity or individual health.
- • Local guidelines may use different terminology and action points.
Sources
- NICE overweight and obesity management guidance
Waist circumference and waist-to-height ratio
Two adults can have the same BMI and different fat distribution. Abdominal or visceral fat carries important metabolic risk, so waist measurements can identify information BMI misses. The NHLBI healthy-weight guidance notes increased risk above 35 inches for women and 40 inches for men.
Waist-to-height ratio adds a height-adjusted view. A practical message is to keep the waist below half the height when the measure is appropriate. The future Waist Circumference Chart and Waist-to-Hip Ratio Chart can expand this comparison as those pages are published.
Waist measurements that add context to BMI
BMI does not show where fat is stored. Waist circumference and waist-to-height ratio can identify central adiposity that BMI may miss.
| Measure | Reference point | What it adds |
|---|---|---|
| Waist circumference for women | More than 35 in (88 cm) | NHLBI identifies higher cardiometabolic risk at this level. |
| Waist circumference for men | More than 40 in (102 cm) | NHLBI identifies higher cardiometabolic risk at this level. |
| Waist-to-height ratio | Below 0.5 | NICE advises keeping the waist less than half the height. |
| Increased central adiposity | Waist-to-height ratio 0.50 to 0.59 | Risk of type 2 diabetes, hypertension, and cardiovascular disease is increased. |
| High central adiposity | Waist-to-height ratio 0.60 or higher | Risk is further increased and deserves clinical context. |
Notes
- • Measure the waist just above the hipbones after breathing out normally; keep the tape horizontal and snug without compressing the skin.
- • Pregnancy, abdominal swelling, and some medical conditions can make waist measures unsuitable.
Sources
- NHLBI Aim for a Healthy Weight
- NICE central adiposity guidance
BMI before and during pregnancy
Pregnancy changes body weight through fetal growth, placenta, amniotic fluid, blood volume, and tissue changes. Use prepregnancy BMI to set a weight-gain range rather than classifying a current pregnancy weight with the ordinary adult BMI chart.
The singleton ranges below follow the CDC pregnancy weight-gain guidance. Twins and higher-order pregnancies need different goals, and medical conditions can change the plan.
Prepregnancy BMI and singleton pregnancy weight gain
Pregnancy weight-gain recommendations use BMI measured before pregnancy. BMI calculated during pregnancy should not be interpreted with ordinary adult categories.
| Prepregnancy category | Prepregnancy BMI | Recommended total gain for one baby | Approximate metric range |
|---|---|---|---|
| Underweight | Below 18.5 | 28–40 lb | 12.5–18 kg |
| Healthy weight | 18.5 to 24.9 | 25–35 lb | 11.5–16 kg |
| Overweight | 25.0 to 29.9 | 15–25 lb | 7–11.5 kg |
| Obesity | 30.0 or higher | 11–20 lb | 5–9 kg |
Notes
- • Twin and higher-order pregnancies use different ranges.
- • A prenatal clinician should personalize the goal when nausea, fetal growth, diabetes, hypertension, or other conditions affect weight gain.
Sources
- CDC Weight Gain During Pregnancy
BMI limitations: muscle, age, body composition, and illness
BMI works best as one screening attribute inside a broader assessment. It can overstate body-fat risk in a muscular adult, miss low muscle mass in an older adult, and become unreliable when pregnancy, fluid retention, amputation, or rapid unplanned weight change affects the number on the scale.
Situations where BMI needs extra context
BMI is useful for population screening and quick clinical triage, but it cannot directly measure body fat, muscle, bone, fluid, or fat distribution.
| Situation | Why BMI may mislead | Useful additional information |
|---|---|---|
| High muscle mass | Muscle can raise body weight without the same body-fat level. | Waist measure, body composition, fitness, and metabolic markers. |
| Older adulthood | Muscle loss can occur even when BMI stays stable. | Strength, function, nutrition, unplanned weight change, and waist size. |
| Pregnancy | Fetal growth, placenta, fluid, and blood-volume changes alter weight. | Prepregnancy BMI and pregnancy-specific weight-gain guidance. |
| Edema or ascites | Fluid retention can increase weight rapidly. | Clinical exam, symptom pattern, and the cause of fluid accumulation. |
| Amputation or limb difference | Standard weight-to-height equations do not reflect missing tissue. | Specialized clinical adjustment and body-composition assessment. |
| Very short or very tall stature | The height-squared formula can distort body-size comparisons at extremes. | Waist-to-height ratio and individualized assessment. |
| Normal BMI with central fat | BMI can miss abdominal fat and metabolic risk. | Waist circumference, blood pressure, A1C, glucose, and lipid values. |
| Eating disorder or unplanned weight loss | A BMI category may hide rapid or clinically important change. | Weight history, symptoms, nutrition intake, and prompt professional review. |
Notes
- • Use person-first, nonjudgmental language. A BMI category describes a screening result, not a person.
Sources
- NHLBI healthy-weight guidance
- NICE obesity guidance
What to do after calculating BMI
First, confirm the measurements and units. Next, review the result beside waist size, recent weight trajectory, nutrition, activity, medicines, symptoms, blood pressure, glucose, A1C, and cholesterol. A clinician can then decide whether monitoring, nutrition support, medical testing, or treatment is appropriate.
How to respond to a BMI result
The best next step depends on the BMI range, symptoms, weight trajectory, waist size, and related health measurements.
| Finding | Reasonable next step | When to seek faster review |
|---|---|---|
| BMI below 18.5 | Review nutrition, weight history, medicines, and possible causes with a clinician. | Unplanned loss, weakness, fainting, vomiting, or signs of an eating disorder. |
| BMI 18.5 to 24.9 | Maintain health-supporting habits and review waist or metabolic markers when relevant. | Rapid weight change or concerning symptoms despite the category. |
| BMI 25.0 to 29.9 | Add waist measurement, blood pressure, glucose, A1C, and lipid context. | Symptoms or known heart, liver, kidney, or metabolic disease. |
| BMI 30.0 or higher | Discuss a comprehensive, stigma-free health assessment and treatment options. | Breathing problems, severe mobility limits, pregnancy concerns, or uncontrolled risk factors. |
| Child or teen result | Plot BMI-for-age using exact age and sex; review the growth pattern. | Rapid percentile crossing, delayed growth, or severe-obesity range. |
| Pregnancy | Use prepregnancy BMI and pregnancy-specific gain goals. | Severe vomiting, rapid swelling, sudden gain, headache, or high blood pressure. |
| Calculator result conflicts with health status | Trust the broader clinical picture rather than BMI alone. | Any urgent symptoms or major unexplained change. |
Notes
- • Do not start a restrictive diet, medication, or weight-loss plan solely from an online BMI result.
Sources
- CDC BMI guidance
- NHLBI healthy-weight guidance
Frequently asked questions about BMI
What is BMI?
Body mass index is weight in kilograms divided by height in meters squared. It is a screening measure of weight relative to height, not a direct body-fat test.
What is a healthy BMI for adults?
The standard healthy-weight BMI range for adults age 20 and older is 18.5 to 24.9.
At what BMI does overweight begin?
The standard adult overweight category begins at BMI 25.0. Some clinical guidelines use a lower action threshold of 23.0 for certain populations.
At what BMI does obesity begin?
The standard adult obesity category begins at BMI 30.0. Class 2 begins at 35.0 and class 3 begins at 40.0.
Does a normal BMI guarantee good health?
No. A person can have a BMI in the healthy range and still have central adiposity, high blood pressure, abnormal glucose, low fitness, or another health concern.
Is BMI accurate for athletes?
BMI can overestimate body fat in people with high muscle mass because it cannot distinguish muscle from fat.
Should children use the adult BMI chart?
No. Ages 2 through 19 need BMI-for-age percentiles based on exact age and sex. Children younger than 2 generally use weight-for-length standards.
Does BMI change with adult age?
The standard adult category cutoffs stay the same from age 20 onward, but clinicians interpret BMI more cautiously in older adults because muscle, function, and nutrition matter.
Can BMI be used during pregnancy?
Prepregnancy BMI helps set pregnancy weight-gain goals. BMI calculated later in pregnancy should not be classified with the ordinary adult chart.
Why do some guidelines use lower BMI thresholds?
Some populations develop central adiposity, type 2 diabetes, and cardiovascular risk at lower BMI values, so certain guidelines lower screening action points.
Is waist circumference better than BMI?
The measures answer different questions. BMI describes weight relative to height, while waist measures help estimate central fat distribution. Using both often gives better context.
How often should I calculate BMI?
There is no universal schedule. Recheck when height or weight changes meaningfully, during routine health reviews, or when a clinician is monitoring growth or treatment.
Can BMI diagnose obesity-related disease?
No. BMI can identify a screening category, but diagnosis and risk assessment require medical history, examination, and other measurements.
What should I do with an unexpected BMI result?
Repeat height and weight measurements, check the units, review recent weight change, and discuss the result with a healthcare professional when it remains unexpected or concerning.
Sources
These organizations publish the reference categories and interpretation guidance used throughout the page. URLs are shown in plain text for transparent source checking.
- 1. Centers for Disease Control and Prevention — Adult BMI Categories
https://www.cdc.gov/bmi/adult-calculator/bmi-categories.html - 2. Centers for Disease Control and Prevention — Child and Teen BMI Categories
https://www.cdc.gov/bmi/child-teen-calculator/bmi-categories.html - 3. National Heart, Lung, and Blood Institute — Aim for a Healthy Weight
https://www.nhlbi.nih.gov/health/heart-healthy-living/healthy-weight - 4. Centers for Disease Control and Prevention — Weight Gain During Pregnancy
https://www.cdc.gov/maternal-infant-health/pregnancy-weight/index.html - 5. National Institute for Health and Care Excellence — Identifying overweight, obesity and central adiposity
https://www.nice.org.uk/guidance/ng246/chapter/Identifying-and-assessing-overweight-obesity-and-central-adiposity