Health & Medical · Body composition reference
Body Fat Percentage Chart by Sex, Age, and Measurement Method
Compare commonly used adult body-fat ranges, research-derived age bands, fat and lean mass, measurement methods, smart-scale limitations, athlete and older-adult context, and practical tracking steps.
Body fat percentage is an estimate, not a diagnosis. A category does not prove fitness, metabolic health, nutritional status, or disease. Read the ChartsLoom Disclaimer.
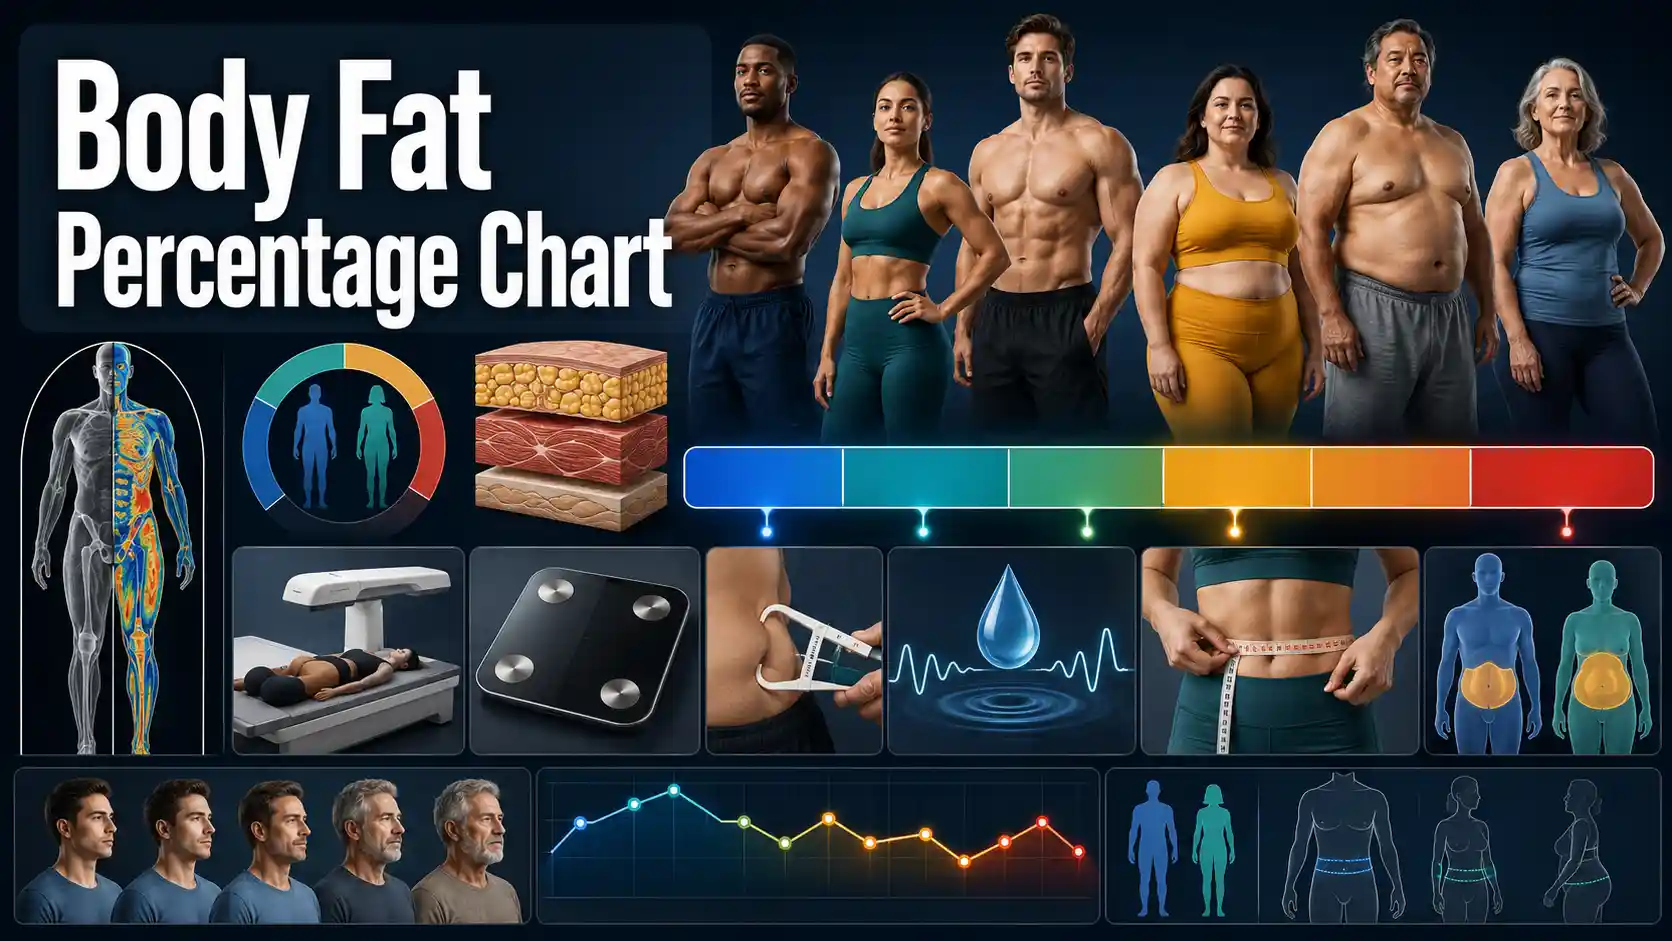
What is a healthy body fat percentage?
No single percentage is healthy for everyone. Common adult reference bands differ by sex-reference group, and useful interpretation also depends on age, fat distribution, muscle, fitness, health markers, life stage, and measurement method.
The American Council on Exercise reference bands describe essential-fat, athlete, fitness, acceptable, and higher body-fat categories. Research published in the American Journal of Clinical Nutrition offers age-specific population context, but neither source creates a universal personal target.
- Definition
- Fat mass ÷ total mass
- Adult reference
- Ranges differ by sex
- Measurement
- Every method estimates
- Best interpretation
- Use a trend plus context
The percentage estimates how much of total body weight is fat tissue.
Common fitness bands use higher reference values for female physiology than male physiology.
DXA, BIA, skinfolds, and circumference equations can return different results.
Add waist size, muscle, strength, health markers, symptoms, and measurement conditions.
Body fat percentage answers a different question than BMI
BMI compares weight with height, while body fat percentage estimates adiposity. The CDC explanation of BMI limitations notes that BMI cannot separate fat, muscle, and bone or show where fat is carried. Body-fat testing adds composition detail but also introduces method-specific error.
Adult body fat percentage categories
These widely used fitness reference bands describe body-fat percentage in adults. They are educational categories rather than universal medical diagnoses.
Swipe horizontally inside the table to view every column.
| Reference category | Female reference | Male reference | How to interpret it |
|---|---|---|---|
| Essential fat — Essential physiological fat | 10%–13% | 2%–5% | The minimum fat needed for basic physiological functions. Persistently lower values may be unsafe. |
| Athletes | 14%–20% | 6%–13% | Often seen in trained athletes; the appropriate level depends on sport, health, hormones, recovery, and performance. |
| Fitness | 21%–24% | 14%–17% | A lean fitness-oriented reference band, not a requirement for health. |
| Acceptable or average | 25%–31% | 18%–24% | A broad commonly used adult reference range for nonathletes. |
| Obesity reference threshold — Higher body-fat reference threshold | 32% or higher | 25% or higher | A commonly cited body-composition threshold; clinical risk still depends on fat distribution, health markers, and measurement accuracy. |
Body fat percentage equals estimated fat mass divided by total body mass, multiplied by 100.
- • The source uses female and male reference groups. Individual physiology, hormones, medications, disability, ethnicity, and life stage can affect interpretation.
- • Different organizations, studies, and devices may use different labels or cutoffs. Do not treat category boundaries as exact biological lines.
Download or export
Visual body fat percentage reference bands
These commonly used adult fitness categories are descriptive reference bands. They do not diagnose health, performance, or disease.
Female reference
Essential fat
10%–13%
Athletes
14%–20%
Fitness
21%–24%
Acceptable
25%–31%
Obesity reference
32%+
Male reference
Essential fat
2%–5%
Athletes
6%–13%
Fitness
14%–17%
Acceptable
18%–24%
Obesity reference
25%+
Text summary
Female reference bands are 10%–13% essential fat, 14%–20% athletes, 21%–24% fitness, 25%–31% acceptable, and 32% or higher as an obesity reference. Male bands are 2%–5%, 6%–13%, 14%–17%, 18%–24%, and 25% or higher.
Research-derived body fat ranges by age
These age bands come from research that linked body-fat percentage with healthy adult BMI values. They provide context, not a universal target or diagnosis.
Swipe horizontally inside the table to view every column.
| Age group | Female reference range | Male reference range | Important limitation |
|---|---|---|---|
| 20–39 years — Young-adult research reference | 21%–32% | 8%–19% | A broad population reference; fitness, reproductive health, ethnicity, and measurement method can change interpretation. |
| 40–59 years | 23%–33% | 11%–21% | Average body composition often changes with age, but higher fat is not automatically harmless. |
| 60–79 years | 24%–35% | 13%–24% | Older adults also need muscle, strength, function, nutrition, waist size, and weight-trend assessment. |
| Younger than 20 | Do not use this adult table — Adult bands not for children | Do not use this adult table | Children and teens require age-, sex-, growth-, and development-specific assessment. |
| Age 80 or older | No single universal range | No single universal range | Frailty, sarcopenia, illness, hydration, and device limitations become especially important. |
Percent of total body mass estimated as fat mass.
- • The bands are research-derived reference values and are not official diagnostic categories.
- • Aging commonly reduces muscle and can increase fat percentage even when body weight changes little.
Download or export
Age context does not turn a higher percentage into an automatic goal
Body fat often rises as muscle mass declines with age. That population pattern does not mean every increase is harmless. Strength, waist size, blood pressure, glucose, lipids, mobility, nutrition, and weight direction still matter.
Body fat mass and lean mass calculator
Enter a measured or estimated body-fat percentage and total body weight. The calculator converts the percentage into estimated fat mass and fat-free mass; it does not estimate body fat from appearance.
Estimated composition
37.5 lb fat
112.5 lb fat-free mass
Reference context
Acceptable reference range
Within the research-derived age band of 21%–32%.
Fat-free mass includes water, bone, organs, connective tissue, and muscle. It is not the same as skeletal-muscle mass. Category labels are broad references, not medical diagnoses.
Body fat mass and lean mass examples
Body fat percentage can be converted into estimated fat mass and fat-free mass when total body weight is known.
Swipe horizontally inside the table to view every column.
| Body weight | Body fat percentage | Estimated fat mass | Estimated fat-free mass |
|---|---|---|---|
| 120 lb (54.4 kg) | 15% | 18 lb (8.2 kg) | 102 lb (46.3 kg) |
| 120 lb (54.4 kg) | 25% | 30 lb (13.6 kg) | 90 lb (40.8 kg) |
| 150 lb (68.0 kg) | 20% | 30 lb (13.6 kg) | 120 lb (54.4 kg) |
| 150 lb (68.0 kg) | 30% | 45 lb (20.4 kg) | 105 lb (47.6 kg) |
| 180 lb (81.6 kg) | 15% | 27 lb (12.2 kg) | 153 lb (69.4 kg) |
| 180 lb (81.6 kg) | 25% | 45 lb (20.4 kg) | 135 lb (61.2 kg) |
| 200 lb (90.7 kg) | 20% | 40 lb (18.1 kg) | 160 lb (72.6 kg) |
| 200 lb (90.7 kg) | 35% | 70 lb (31.8 kg) | 130 lb (59.0 kg) |
Fat mass = body weight × body-fat decimal. Fat-free mass = body weight − fat mass.
- • Fat-free mass includes muscle, bone, organs, water, and connective tissue; it is not the same as skeletal-muscle mass.
- • The calculation is only as accurate as the entered body-fat percentage.
Download or export
Body fat measurement methods compared
Every method estimates body composition differently. Results from two methods should not be treated as interchangeable.
Swipe horizontally inside the table to view every column.
| Method | What it measures or estimates | Strengths | Main limitations |
|---|---|---|---|
| DXA scan — Detailed clinical body-composition method | Uses low-dose X-rays to estimate regional and total fat, lean tissue, and bone mineral | Detailed regional results; useful clinical and research reference | Cost, access, device calibration, body size, and analysis software affect results |
| Bioelectrical impedance (BIA) | Estimates body water and converts it to fat-free mass and fat mass | Fast, noninvasive, widely available in scales and handheld devices | Hydration, food, exercise, temperature, alcohol, and device equations can shift the result — Hydration-sensitive method |
| Skinfold calipers | Measures subcutaneous skinfold thickness at selected sites and applies an equation | Low cost and useful for trend tracking with a skilled tester | Technique, site selection, equation choice, and very lean or high-fat bodies affect accuracy |
| Air-displacement plethysmography | Estimates body density from air displacement, then converts density to body fat | Quick and noninvasive; often called a BOD POD test | Cost, clothing, hair, lung-volume assumptions, and conversion equations affect results |
| Hydrostatic weighing | Estimates body density from underwater weight and displaced water | Historically used as a laboratory reference method | Requires full exhalation and water immersion; residual lung volume affects accuracy |
| MRI or CT | Images fat depots, including visceral and subcutaneous fat | Can show fat distribution and specific tissue compartments | Cost, access, scan time, and radiation exposure for CT limit routine use |
| Circumference equation | Uses body circumferences and height in a population-derived formula | Portable, inexpensive, and useful when technique is standardized | Neck, waist, hip, posture, tape tension, and population differences can create error |
Results are usually reported as a percentage of total body mass and may also include kilograms or pounds of fat and lean tissue.
- • For trend tracking, repeat the same method under similar conditions instead of comparing unrelated devices.
- • Even laboratory methods have assumptions and measurement error; no method directly counts every fat cell.
Download or export
DXA shows regional fat, lean tissue, and bone estimates
A DXA body composition analysis can provide regional and total estimates, but it still depends on equipment, software, positioning, and technical assumptions. Repeat testing is most useful when the protocol stays consistent.
Factors that change a smart-scale or BIA body fat reading
Bioelectrical impedance readings can move because body water and measurement conditions changed, even when true body fat did not.
Swipe horizontally inside the table to view every column.
| Factor | Possible effect on the estimate | How to improve consistency | Interpretation tip |
|---|---|---|---|
| Hydration status — Major source of BIA variation | Dehydration or fluid retention can shift estimated fat and lean mass | Measure under similar hydration conditions | Do not interpret a sudden one-day change as true fat gain or loss |
| Recent food or drink | Adds gastrointestinal weight and changes fluid distribution | Use a consistent time, often before a meal | Compare like with like |
| Exercise | Sweating and blood-flow changes alter impedance | Avoid measuring immediately after training | Wait until temperature and hydration normalize |
| Alcohol | Changes hydration and fluid balance | Avoid comparing a post-alcohol reading with a normal baseline | Expect more variability |
| Menstrual-cycle changes | Fluid retention can change weight and impedance | Compare similar cycle phases when detailed tracking matters | Use a multiweek trend |
| Skin and room temperature | Cold extremities and contact quality can change current flow | Use the device in a stable indoor environment | Poor electrode contact can produce unreliable readings |
| Different device or algorithm | Manufacturers use different equations and reference populations | Use the same device and mode — Do not mix device baselines | A new device creates a new baseline |
| Time of day | Meals, fluid, activity, and gravity change fluid distribution | Measure at a consistent time | Weekly averages are more useful than isolated readings |
BIA means bioelectrical impedance analysis.
- • Consumer devices estimate body composition; they do not directly measure fat tissue.
- • Look for a persistent trend over several weeks rather than small daily fluctuations.
Download or export
A smart-scale change is not always a body-fat change
Bioelectrical impedance responds strongly to body water. Meals, exercise, alcohol, temperature, menstrual-cycle fluid shifts, and a different device can move the estimate before true fat tissue changes.
Body fat percentage, BMI, and waist measures compared
These measurements answer different questions. Combining them gives more context than relying on one number.
Swipe horizontally inside the table to view every column.
| Measure | Primary attribute | What it can show | What it cannot show alone |
|---|---|---|---|
| Body fat percentage — Body-composition measure | Estimated proportion of body mass that is fat | Total adiposity and changes in fat versus fat-free mass | Exact visceral-fat risk, fitness, blood pressure, glucose, or disease |
| BMI | Weight relative to height | Fast population-level screening and a consistent adult category system | Fat versus muscle, bone mass, or fat distribution — BMI limitation |
| Waist circumference | Abdominal size | Central adiposity and cardiometabolic-risk context | Total body fat or muscle mass |
| Waist-to-height ratio | Waist relative to stature | Central-fat context across different heights | Total fat mass or regional imaging detail |
| DXA regional fat | Distribution of fat and lean tissue by body region | Android, gynoid, limb, and trunk composition | A diagnosis or complete measure of metabolic health |
| Blood pressure, glucose, and lipids | Cardiometabolic function | Current physiological risk markers | Body composition or physical function |
Use compatible units when calculating ratios.
- • The CDC notes that BMI does not distinguish fat, muscle, and bone or show where fat is carried.
- • A complete assessment may combine body composition, waist, blood pressure, glucose, lipids, fitness, symptoms, and history.
Download or export
Measurement methods should not be mixed as if they were identical
The NIH review of body-composition methods explains that each technique relies on different measured variables and assumptions. A result from one smart scale should not be judged against a skinfold or DXA result as though both used the same model.
When body fat percentage needs extra context
Life stage, health status, training, and measurement conditions can make a category less useful or the estimate less accurate.
Swipe horizontally inside the table to view every column.
| Situation | Why the number may mislead | Useful additional information | Safer interpretation |
|---|---|---|---|
| Competitive athlete | Performance demands and sport type can produce unusually low or high values | Energy availability, hormones, recovery, strength, injuries, and performance | Do not pursue the lowest possible percentage |
| Older adult | Low muscle can coexist with an average body-fat percentage or ordinary BMI | Strength, gait, function, protein intake, weight change, and sarcopenia screening | Protect muscle and function, not only scale weight |
| Pregnancy | Expected changes in fat, water, fetus, placenta, breasts, and blood volume alter composition | Prepregnancy BMI, pregnancy weight-gain guidance, fetal growth, and clinical care | Do not use ordinary adult body-fat targets to guide pregnancy weight — Pregnancy requires separate guidance |
| Postpartum period | Fluid shifts, lactation, sleep, and recovery change measurements | Recovery, nutrition, pelvic health, mental health, and feeding needs | Allow time and use supportive, nonurgent goals |
| Edema, kidney, heart, or liver disease | Fluid shifts can strongly distort BIA and body weight | Clinical fluid assessment and condition-specific monitoring | Consumer body-fat readings may be unreliable |
| Amputation or mobility limitation | Standard equations and device assumptions may not fit the body | Specialized assessment and functional measures | Use adapted clinical methods |
| History of eating disorder or body-image distress | Frequent measurement can reinforce harmful checking or restriction | Mental-health support, nourishment, function, and clinician guidance | Avoid unnecessary tracking when it worsens symptoms — Tracking may cause harm |
Context determines whether measuring body fat is helpful, neutral, or potentially harmful.
- • Body-fat goals should support health, function, recovery, and quality of life rather than appearance alone.
- • Seek qualified care for unexplained weight change, menstrual changes, weakness, fatigue, or restrictive eating.
Download or export
Lower is not always healthier
Very low body fat can accompany low energy availability, hormonal disruption, menstrual changes, poor recovery, weakness, bone stress injury, or restrictive eating. Seek professional help when a low result appears with symptoms or compulsive weight-control behavior.
How to track body fat percentage more reliably
A standardized process reduces noise and makes long-term changes easier to interpret.
Swipe horizontally inside the table to view every column.
| Tracking step | Recommended approach | Why it helps | Common mistake |
|---|---|---|---|
| Choose one method | Use the same device, tester, equation, and measurement sites — Most important consistency rule | Keeps the baseline consistent | Comparing a smart scale directly with DXA or calipers |
| Standardize timing | Measure at a similar time of day and under similar food, fluid, and exercise conditions | Reduces short-term fluid variation | Measuring randomly throughout the day |
| Repeat measurements | Use several readings and review a weekly or monthly trend | Separates persistent change from noise | Reacting to one result |
| Track body weight too | Record total weight beside body-fat percentage | Allows fat-mass and fat-free-mass estimates | Watching percentage without knowing total mass |
| Add waist and performance | Track waist, strength, endurance, symptoms, and clothing fit when useful | Shows changes that one percentage may miss | Treating body fat as the only outcome |
| Use realistic intervals | Expect gradual change and allow for measurement error | Reduces unsafe or unsustainable targets | Expecting several percentage points of true fat change in days |
| Review unexpected changes | Repeat under standardized conditions and seek help for unexplained loss or gain — Unexpected change requires review | Identifies device error, fluid change, illness, or nutrition concerns | Assuming every change is fat tissue |
Trend intervals depend on the method; frequent daily body-fat estimates are usually noisier than body weight.
- • Use the same method when judging progress. A method change can create an artificial jump.
- • Stop tracking or reduce frequency if measurement increases anxiety, compulsive behavior, or unsafe restriction.
Download or export
Frequently asked questions
What is body fat percentage?
Body fat percentage is the estimated share of total body mass made up of fat tissue. The remaining fat-free mass includes muscle, water, bone, organs, and connective tissue.
What is a healthy body fat percentage?
There is no single universal healthy percentage. Common adult reference bands differ by sex-reference group and age, while health also depends on fat distribution, muscle, fitness, blood pressure, glucose, lipids, symptoms, and measurement method.
Is body fat percentage more accurate than BMI?
It answers a different question. Body fat percentage estimates adiposity, while BMI compares weight with height. Body fat estimates also have measurement error, so neither number should be used alone.
Why are female body fat ranges higher?
Female physiology generally requires more essential fat for reproductive, hormonal, and other functions. The exact meaning still varies by life stage, health, hormones, and source population.
Can body fat percentage be too low?
Yes. Very low body fat can be associated with low energy availability, hormonal disruption, menstrual changes, impaired recovery, bone stress injuries, weakness, and other health problems.
Can a smart scale measure body fat accurately?
A smart scale estimates body fat through bioelectrical impedance. It can support trend tracking, but hydration, meals, exercise, temperature, and device algorithms can shift the result.
What is the most accurate body fat test?
No method is perfect. DXA provides detailed regional fat, lean, and bone estimates, while multi-compartment laboratory models may improve accuracy in research. Access, purpose, and repeatability matter.
How much can body fat percentage change in one day?
True fat tissue changes very little in one day. A large daily shift usually reflects hydration, food, exercise, temperature, device variability, or measurement technique.
How do I calculate fat mass from body fat percentage?
Multiply body weight by the body-fat percentage written as a decimal. A 150-pound person at 20% body fat has an estimated 30 pounds of fat mass.
Is fat-free mass the same as muscle mass?
No. Fat-free mass includes muscle, water, bone, organs, blood, and connective tissue. A device may separately estimate skeletal-muscle mass, but that value also depends on its algorithm.
Should body fat percentage increase with age?
Average body fat often rises as muscle declines with age, but an age-related increase is not automatically harmless. Strength, function, waist size, nutrition, health markers, and weight direction remain important.
Can athletes use ordinary body fat categories?
The categories can provide context, but sport demands, training phase, performance, hormones, recovery, and energy availability matter more than reaching the lowest possible number.
Should children use adult body fat percentage ranges?
No. Children and teenagers are growing and require age-, sex-, development-, and method-specific assessment. Adult category tables should not be used to classify them.
How often should I measure body fat?
For most people, weekly or monthly trend checks under standardized conditions are more useful than daily readings. Less frequent testing is appropriate when tracking creates anxiety or compulsive behavior.
Sources
These references support the body-fat category bands, age context, BMI comparison, measurement methods, and DXA guidance used on this page.
American Council on Exercise
Body Fat Percentage: Charting Averages in Men and Women
https://www.acefitness.org/about-ace/press-room/in-the-news/8602/body-fat-percentage-charting-averages-in-men-and-women-very-well-health/
Commonly used adult body-fat reference categories for essential fat, athletes, fitness, acceptable ranges, and obesity thresholds.
American Journal of Clinical Nutrition
Healthy Percentage Body Fat Ranges: An Approach for Developing Guidelines Based on Body Mass Index
https://pubmed.ncbi.nlm.nih.gov/10966886/
Research-derived age- and sex-specific body-fat ranges linked with healthy adult BMI values; these bands are not universal diagnostic cutoffs.
Centers for Disease Control and Prevention
About Body Mass Index
https://www.cdc.gov/bmi/about/index.html
Explains that BMI does not distinguish fat, muscle, or bone and does not show where body fat is carried.
UC Davis Health
DXA Body Composition Analysis
https://health.ucdavis.edu/sports-medicine/resources/dxa-info
Overview of DXA assessment of fat tissue, lean mass, and bone density.
National Institutes of Health, PubMed Central
Body Composition Methods: Comparisons and Interpretation
https://pmc.ncbi.nlm.nih.gov/articles/PMC2769821/
Technical review of DXA, bioelectrical impedance, skinfolds, air displacement, hydrostatic weighing, and other methods.
Use one consistent method and interpret the pattern
Record body fat under similar conditions, calculate fat and fat-free mass when useful, and review the trend beside waist size, muscle, strength, performance, symptoms, blood pressure, glucose, lipids, health history, and personal goals.