Health & Medical · Physical activity reference
Calorie Burn Chart by Activity, Weight, Time, and Intensity
Compare walking, running, cycling, swimming, gym exercise, sports, and household activities. Calculate a MET-based estimate and understand why real calorie expenditure can differ.
Calorie-burn numbers are estimates, not measurements or exercise prescriptions. Stop activity and seek appropriate help for chest pain, fainting, severe breathlessness, confusion, unusual neurologic symptoms, or a serious injury. Read the ChartsLoom Disclaimer.
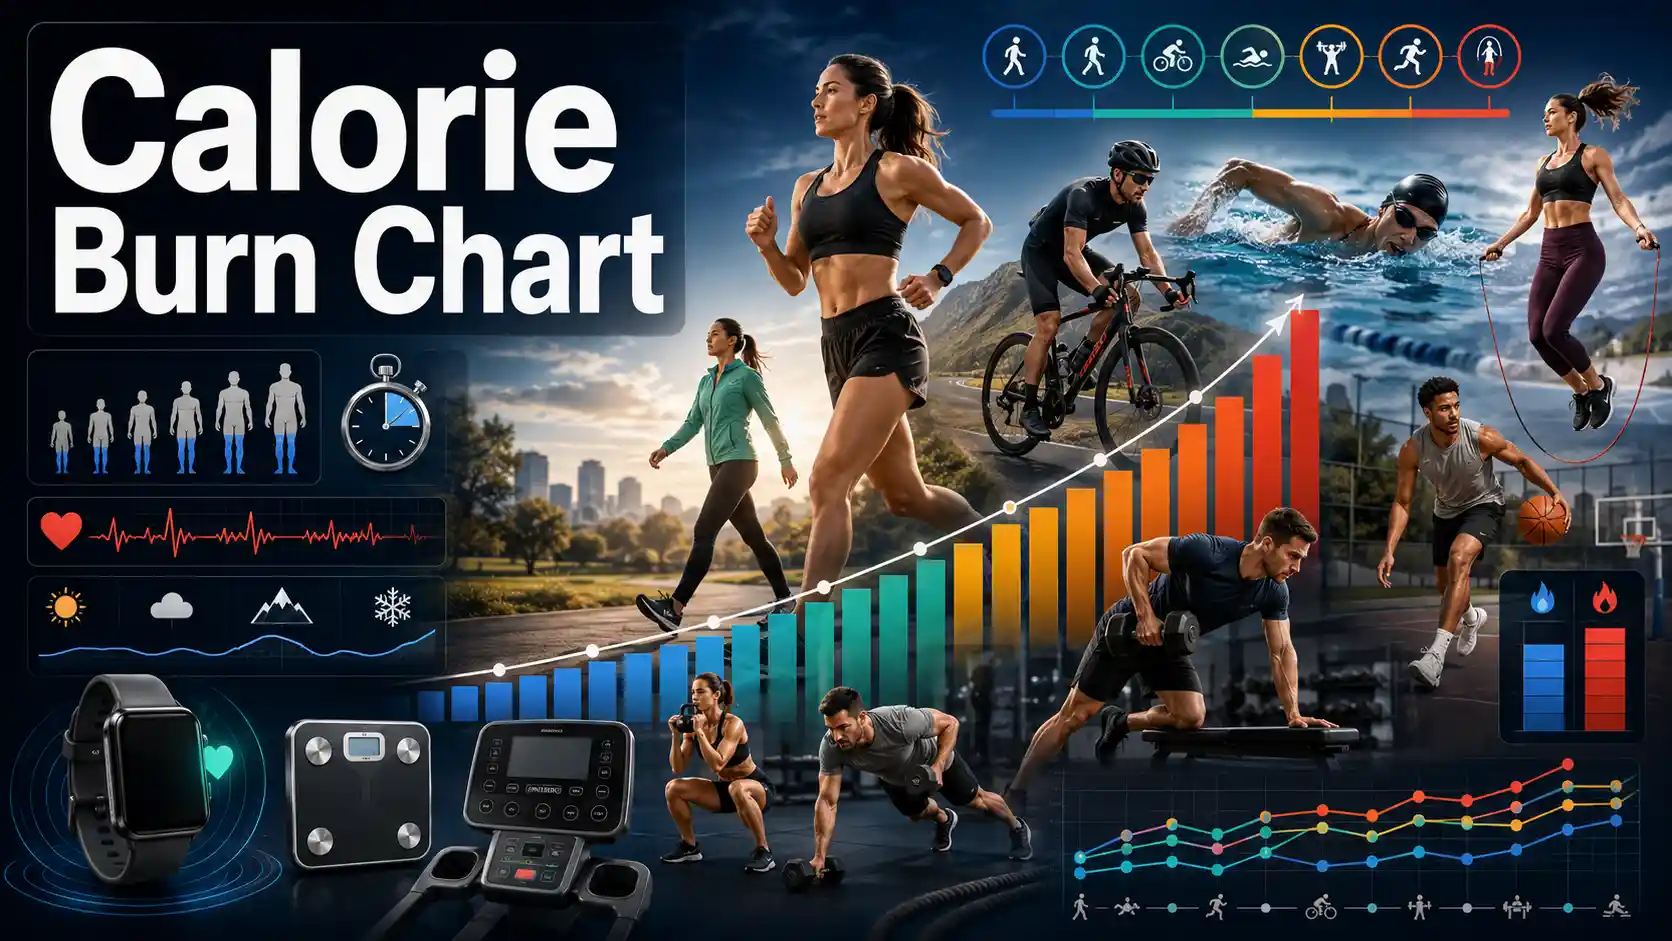
How many calories does exercise burn?
Calorie burn increases with activity intensity, body weight, and active time. For a 155-pound adult, 30 minutes is approximately 140 calories for moderate walking, 177 for brisk walking, 314 for running at 5 mph, and 406 for jumping rope using standard MET estimates.
The 2024 Adult Compendium of Physical Activities assigns MET values to specific activities. The foundational MET framework defines one MET as the conventional energy cost of quiet sitting. These values support comparison, but they do not reproduce an individual laboratory measurement.
- Intensity unit
- MET
- Weight effect
- Higher weight, higher estimate
- Time effect
- Minutes matter
- Best use
- Compare patterns
A MET compares the energy cost of an activity with quiet resting energy.
Standard MET equations scale the estimate with body weight, though individual metabolism still varies.
At a steady intensity, estimated calories rise almost in proportion to active duration.
Use estimates to compare activities and sessions, not as exact proof of energy balance.
The fastest answer: match the exact activity description
“Walking,” “cycling,” and “weights” each cover broad intensity ranges. Select the row that best matches pace, incline, resistance, work-to-rest ratio, terrain, and actual active time. A precise-looking number from the wrong activity description is less useful than a rounded estimate from the closest match.
Calories burned in 30 minutes by activity and body weight
Estimated gross calories for common activities using published MET values. The figures describe total energy used during the activity, including energy the body would have used at rest.
Swipe horizontally inside the table to view every column.
| Activity | METs | 125 lb | 155 lb | 185 lb | 215 lb |
|---|---|---|---|---|---|
| Walking, 2.5 mph | 3 | 89 | 111 | 132 | 154 |
| Walking, 2.8–3.4 mph | 3.8 | 113 | 140 | 167 | 195 |
| Walking, 3.5–3.9 mph | 4.8 — Brisk walking reference | 143 | 177 | 211 | 246 |
| Running, 5 mph | 8.5 | 253 | 314 | 374 | 435 |
| Running, 6 mph | 9.3 | 277 | 343 | 410 | 476 |
| Cycling, under 10 mph | 4 | 119 | 148 | 176 | 205 |
| Cycling, 12–13.9 mph | 8 | 238 | 295 | 352 | 410 |
| Swimming freestyle, slow | 5.8 | 173 | 214 | 256 | 297 |
| Swimming freestyle, fast | 9.8 | 292 | 362 | 432 | 502 |
| Elliptical trainer, moderate | 5 | 149 | 185 | 220 | 256 |
| Weight training, multiple exercises | 3.5 | 104 | 129 | 154 | 179 |
| Body-weight circuit training | 6 | 179 | 221 | 264 | 307 |
| Jumping rope, general | 11 — High MET activity | 327 | 406 | 485 | 563 |
| Basketball game | 8 | 238 | 295 | 352 | 410 |
| Golf, walking and carrying clubs | 4.3 | 128 | 159 | 189 | 220 |
| Vacuuming | 3 | 89 | 111 | 132 | 154 |
| Mopping, standing | 3.5 | 104 | 129 | 154 | 179 |
| Carrying groceries, level ground | 3.5 | 104 | 129 | 154 | 179 |
Estimated kilocalories during 30 minutes. Body weights are approximately 57, 70, 84, and 98 kg.
- • Values use the conventional equation: calories per minute = MET × 3.5 × body weight in kg ÷ 200.
- • These are group-based estimates. Actual energy use can differ with pace, fitness, technique, terrain, temperature, equipment, rest periods, and individual metabolism.
Download or export
Calories burned by activity duration at 155 pounds
Duration scales the estimate almost linearly when activity intensity stays consistent. Longer sessions often include pace changes, rests, warm-up, and cool-down periods.
Swipe horizontally inside the table to view every column.
| Activity | METs | 15 min | 30 min | 45 min | 60 min |
|---|---|---|---|---|---|
| Walking, moderate pace | 3.8 | 70 | 140 | 210 | 281 |
| Walking, brisk pace | 4.8 | 89 | 177 — Common 30-minute brisk walk estimate | 266 | 354 |
| Running, 5 mph | 8.5 | 157 | 314 | 471 | 627 |
| Cycling, 12–13.9 mph | 8 | 148 | 295 | 443 | 591 |
| Swimming freestyle, slow | 5.8 | 107 | 214 | 321 | 428 |
| Elliptical, moderate | 5 | 92 | 185 | 277 | 369 |
| Weight training, multiple exercises | 3.5 | 65 | 129 | 194 | 258 |
| Jumping rope | 11 | 203 | 406 | 609 | 812 |
Estimated gross kilocalories for a 155 lb (70 kg) adult.
- • Doubling time doubles a mathematical estimate only when the same MET intensity is maintained throughout.
- • Intervals, stops, downhill sections, and recovery periods reduce average session intensity unless included in the selected MET value.
Download or export
Visual guide to MET intensity and calorie burn
MET values describe the energy cost of an activity relative to quiet sitting. A higher MET usually produces a higher calorie estimate for the same person and duration.
Sedentary or very light
<3.0 METs
Sitting, light cooking, very slow walking
Moderate intensity
3.0–5.9 METs
Moderate walking, leisure cycling, recreational swimming
Vigorous intensity
6.0+ METs
Running, fast cycling, jumping rope, vigorous circuits
Text summary
Activities below 3 METs are generally light, 3.0–5.9 METs are moderate, and 6.0 METs or more are vigorous in absolute-intensity terms. Relative effort can still differ greatly between people.
MET intensity and personal effort answer different questions
The CDC intensity guide classifies 3.0–5.9 METs as moderate and 6.0 METs or more as vigorous in absolute terms. Relative effort still depends on fitness, health, age, medicines, heat, altitude, and disability.
MET intensity chart for physical activity
Absolute intensity groups activities by energy cost without adjusting for an individual’s fitness. Relative effort may be higher or lower for a particular person.
Swipe horizontally inside the table to view every column.
| Absolute intensity | MET range | Talk and effort clues | Examples | Important limitation |
|---|---|---|---|---|
| Sedentary or very light | Below 3.0 METs | Little change in breathing for many adults | Sitting, light meal preparation, very slow walking | Can still feel demanding during illness, disability, or low fitness |
| Moderate | 3.0–5.9 METs — Moderate intensity | Breathing faster; can usually talk but not sing | Brisk walking, leisure cycling, recreational swimming, general yard work | A trained person may experience the same task as light |
| Vigorous | 6.0 METs or more — Vigorous intensity | Breathing hard; only a few words before pausing | Running, fast cycling, vigorous swimming, jumping rope | May be unsafe without progression or medical clearance in some situations |
| Relative moderate effort | About 5–6 on a 0–10 effort scale | Noticeably harder than rest | Depends on the person rather than one MET cutoff | Useful for older adults and people with lower fitness |
| Relative vigorous effort | About 7–8 on a 0–10 effort scale | Substantial effort and breathing change | Depends on fitness, health, medicines, heat, and altitude | Heart-rate medicines can change pulse response |
MET = metabolic equivalent of task.
- • CDC defines 3.0–5.9 METs as moderate absolute intensity and 6.0 METs or more as vigorous absolute intensity.
- • The talk test and perceived effort add useful personal context that a calorie estimate cannot provide.
Download or export
MET-based calorie burn calculator
Choose an activity, body weight, and duration. The calculator returns a gross estimate for total energy used during the activity and a net estimate after subtracting approximate resting energy.
Estimated total calories
177
Gross energy used during the selected time.
Estimated active calories
140
Approximate calories above quiet-resting energy.
Activity context
4.8 METs
Moderate absolute intensity · 5.9 calories per minute.
MET estimates describe groups, not exact individual metabolism. Heart-rate response, movement economy, fitness, age, body composition, terrain, temperature, equipment, and rest periods can move actual energy use above or below the estimate.
Walking and running calorie burn by pace
Pace changes the activity MET and therefore the estimate. Incline, surface, wind, load, running economy, and actual speed can matter as much as the label walking or running.
Swipe horizontally inside the table to view every column.
| Pace | Approximate pace context | METs | 30-min calories at 155 lb |
|---|---|---|---|
| Walking, 2.0–2.4 mph | 25–30 min/mile | 2.8 | 103 |
| Walking, 2.5 mph | 24 min/mile | 3 | 111 |
| Walking, 2.8–3.4 mph | 18–21 min/mile | 3.8 — Moderate walking | 140 |
| Walking, 3.5–3.9 mph | 15–17 min/mile | 4.8 | 177 |
| Walking, 4.0–4.4 mph | 14–15 min/mile | 5.5 | 203 |
| Running, 4.0–4.2 mph | About 13 min/mile | 6.5 | 240 |
| Running, 5.0–5.2 mph | About 12 min/mile | 8.5 — Running pace | 314 |
| Running, 6.0–6.3 mph | About 10 min/mile | 9.3 | 343 |
| Running, 7 mph | About 8.5 min/mile | 11 | 406 |
| Running, 8 mph | About 7.5 min/mile | 12 | 443 |
Estimated gross kilocalories for a 155 lb (70 kg) adult.
- • Running calorie estimates increase with speed, but individual running economy creates meaningful variation.
- • Treadmill incline, hills, sand, pushing a stroller, and carrying a load require a different activity code.
Download or export
Gym and conditioning exercise calorie burn chart
Exercise labels such as weights, circuits, and cardio cover wide intensity ranges. Use the description that most closely matches movement, load, pace, and rest time.
Swipe horizontally inside the table to view every column.
| Exercise | METs | 30-min calories at 155 lb | Absolute intensity |
|---|---|---|---|
| Body-weight resistance, general | 3 | 111 | Moderate |
| Weight training, multiple exercises | 3.5 — General resistance training | 129 | Moderate |
| Calisthenics, moderate | 3.8 | 140 | Moderate |
| Elliptical, moderate | 5 | 185 | Moderate |
| Circuit training, moderate | 5 | 185 | Moderate |
| Resistance training, vigorous | 6 | 221 | Vigorous |
| Body-weight circuit | 6 | 221 | Vigorous |
| Calisthenics, vigorous | 7.5 | 277 | Vigorous |
| Aerobic exercise, general | 7.3 | 269 | Vigorous |
| Elliptical, vigorous | 9 | 332 | Vigorous |
| Kettlebell swings | 9.8 | 362 | Vigorous |
| Jumping rope, general | 11 — High-intensity activity | 406 | Vigorous |
Estimated gross kilocalories for a 155 lb (70 kg) adult.
- • Strength-training estimates change substantially with load, exercise selection, work-to-rest ratio, and how much of the session is actually active.
- • Wearables may classify resistance exercise less accurately because heart rate does not fully describe muscular work.
Download or export
Workout calories do not capture every training benefit
Resistance training may show fewer calories per minute than vigorous continuous cardio, yet it supports strength, function, bone loading, and muscle retention. Use calorie expenditure as one attribute of a session, not the sole measure of exercise value.
Sports calorie burn chart
Sports energy cost depends on active playing time, position, competition level, substitutions, skill, court or field size, and recovery periods.
Swipe horizontally inside the table to view every column.
| Sport or activity | METs | 30 min at 155 lb | 30 min at 185 lb |
|---|---|---|---|
| Bowling | 3 | 111 | 132 |
| Golf, walking and carrying clubs | 4.3 | 159 | 189 |
| Cricket, batting/bowling/fielding | 4.8 | 177 | 211 |
| Badminton, social | 5.5 | 203 | 242 |
| Basketball, shooting baskets | 5 | 185 | 220 |
| Frisbee, general recreational play | 3 | 111 | 132 |
| Basketball game | 8 — Vigorous team sport | 295 | 352 |
| Football, touch or flag | 8 | 295 | 352 |
| Ultimate frisbee | 8 | 295 | 352 |
| Boxing, punching bag | 5.8 | 214 | 256 |
| Swimming freestyle, slow | 5.8 | 214 | 256 |
| Swimming freestyle, fast | 9.8 | 362 | 432 |
Estimated gross kilocalories.
- • Clock time and active time can differ greatly in team sports and practices.
- • Use a more specific Compendium activity when competitive intensity, drills, coaching, or recreational play differs from the listed row.
Download or export
Household and daily activity calorie burn chart
Daily movement contributes to total energy expenditure even when it is not planned exercise. The estimate applies only to the active portion of the task.
Swipe horizontally inside the table to view every column.
| Household or daily activity | METs | 30 min at 155 lb | 30 min at 185 lb |
|---|---|---|---|
| Cooking or washing dishes, light | 2 | 74 | 88 |
| Laundry, folding or hanging | 2.3 | 85 | 101 |
| Dusting or polishing furniture | 2.5 | 92 | 110 |
| Vacuuming | 3 | 111 | 132 |
| Making a bed or changing linens | 3 | 111 | 132 |
| General house cleaning | 3.3 | 122 | 145 |
| Mopping, moderate | 3.5 | 129 | 154 |
| Carrying groceries, level ground | 3.5 | 129 | 154 |
| Carrying groceries upstairs | 5.3 — Higher-effort household task | 196 | 233 |
| Moving furniture or boxes | 5.8 | 214 | 256 |
| Child care, standing | 3.5 | 129 | 154 |
| Walking and carrying a child | 3 | 111 | 132 |
Estimated gross kilocalories.
- • A one-hour chore may include standing, walking, lifting, and pauses; average energy use can be lower than 60 minutes at one continuous MET value.
- • Non-exercise activity can add meaningful movement across a day but should not be treated as an exact food-calorie offset.
Download or export
Health guidelines focus on activity volume, not calorie targets
The CDC adult activity overview recommends weekly aerobic activity plus muscle-strengthening work. The Physical Activity Guidelines for Americans emphasize regular movement, gradual progression, and health benefits rather than requiring a specific calorie number.
Why calorie burn estimates differ
A chart or wearable calculates an estimate from limited inputs. Differences do not automatically mean that one device or person is wrong.
Swipe horizontally inside the table to view every column.
| Factor | How it changes the estimate | Practical interpretation | Better comparison method |
|---|---|---|---|
| Body weight | MET equations generally produce a larger estimate at a higher weight | Weight is included, but body composition and movement economy remain unmeasured | Use the same current weight when comparing sessions |
| Actual pace or power | Small speed, incline, resistance, or wattage changes can alter energy cost | An activity label may hide a wide intensity range | Record pace, distance, incline, power, or resistance |
| Fitness and movement economy | A trained person may use less oxygen at a familiar submaximal task | Standard METs do not equal personal laboratory measurement | Compare similar sessions over time rather than exact device totals |
| Rest periods | Paused or low-effort time lowers average session expenditure | Workout duration is not always active duration | Track work and recovery separately when useful |
| Heart-rate algorithms | Age, fitness, heat, stress, caffeine, and medicines affect pulse | A watch may overestimate or underestimate when heart rate is unusual | Use a well-fitted device and consistent activity mode |
| Strength exercise | Muscular work, lifting cadence, and rest are difficult to infer from wrist motion | Wearables often disagree during weights and circuits | Use sets, load, reps, and training volume as primary records |
| Temperature and altitude | Heat and altitude can raise heart rate without matching mechanical work | Heart-rate-based calorie estimates may rise | Use effort, pace, and environmental notes together |
| Gross versus active calories — Definition difference | Gross includes resting energy; active calories try to subtract it | Two apps may report different numbers for the same session | Confirm which definition the app uses |
| Individual resting metabolism | The conventional 1-MET value does not fit every person | Standard estimates can systematically differ from measured energy use — Individual MET limitation | Treat results as a range rather than a precise total |
Accuracy improves with direct gas-exchange measurement, but laboratory values still apply to a specific test condition.
- • Use calorie estimates for planning and trend comparison, not as proof of exact energy balance.
- • Exercise has health benefits even when the displayed calorie number is lower than expected.
Download or export
Symptoms and safety override a calorie goal
Do not continue an activity simply to reach a watch, machine, or chart total. Chest pain, fainting, severe breathlessness, confusion, new weakness, severe palpitations, heat-illness signs, or significant injury require stopping and appropriate assessment.
Using calorie burn estimates safely
The calorie number is secondary to symptoms, progressive training, recovery, nutrition, and the person’s medical context.
Swipe horizontally inside the table to view every column.
| Situation | Safer approach | Stop or seek advice when | Do not use the chart to |
|---|---|---|---|
| Starting after inactivity | Begin with manageable time and intensity; increase gradually — Gradual progression | Chest pain, fainting, severe breathlessness, or unusual palpitations occur | Jump directly to the highest-calorie activity |
| Heart, lung, kidney, or metabolic disease | Follow the clinician or rehabilitation plan | Symptoms exceed the advised range or recovery is abnormal | Override exercise restrictions |
| Pregnancy or postpartum | Use pregnancy-aware activity guidance and individual obstetric advice | Bleeding, fluid leakage, chest pain, dizziness, painful contractions, or concerning symptoms occur | Set calorie targets from a generic MET table |
| Older adult or fall risk | Use relative effort, balance, strength, and function as well as METs | New dizziness, instability, chest symptoms, or marked fatigue occurs | Assume a standard MET equals personal effort |
| Heat, humidity, or altitude | Reduce pace, hydrate appropriately, acclimatize, and monitor symptoms | Confusion, collapse, severe headache, chest symptoms, or heat illness signs occur | Chase the usual calorie number in unsafe conditions |
| Weight-management goal | Pair sustainable activity with adequate nutrition, sleep, and medical context | Restriction, compulsive exercise, injury, or eating-disorder symptoms develop | Earn or cancel specific foods calorie for calorie |
| Child or teenager | Use age-appropriate activity and youth-specific references | Pain, fainting, breathing difficulty, or concerning fatigue occurs | Apply adult MET calorie equations as a clinical target |
| Pain or injury | Modify activity and seek assessment when function is limited | Pain is severe, worsening, associated with swelling, weakness, or trauma — Injury warning | Exercise through a potentially serious injury for calorie burn |
Emergency symptoms require local emergency services, not a calculator.
- • Adults generally benefit from regular moderate- or vigorous-intensity aerobic activity plus muscle-strengthening work, but individual plans differ.
- • A lower-calorie activity that can be performed safely and consistently may provide more long-term benefit than an unsustainable high-intensity session.
Download or export
Use five details to improve an estimate
- 1
Choose the closest activity
Match pace, resistance, incline, terrain, and work-to-rest pattern rather than using a broad label.
- 2
Use current body weight
The standard equation scales with kilograms, so an outdated weight changes the result.
- 3
Count active minutes
Separate movement time from breaks, setup, rest, and conversations when possible.
- 4
Label gross or active calories
Gross includes resting energy; active calories subtract an approximate resting amount.
- 5
Track a range and trend
Compare similar sessions over time instead of treating one estimate as an exact total.
Pair calorie estimates with body-composition and metabolic context
A calorie estimate does not show body-fat distribution, muscle mass, blood glucose response, or cardiovascular strain. Use the Body Fat Percentage Chart, BMI Chart, and Blood Sugar Levels Chart for related attributes and limitations.
Frequently asked questions
How does a calorie burn chart work?
A calorie burn chart combines an activity MET value with body weight and time. It estimates energy expenditure for a typical person performing that activity at the described intensity.
What is the formula for calories burned?
A common estimate is MET multiplied by 3.5, multiplied by body weight in kilograms, divided by 200, then multiplied by active minutes.
What is a MET?
A metabolic equivalent of task compares an activity’s energy cost with quiet rest. One conventional MET equals about 3.5 millilitres of oxygen per kilogram per minute.
What is the difference between total and active calories?
Total or gross calories include resting energy used during the activity period. Active or net calories attempt to subtract the energy that would have been used at rest.
Does a heavier person burn more calories doing the same activity?
Standard MET equations usually estimate more calories at a higher body weight. Actual differences also depend on body composition, fitness, movement economy, pace, and technique.
How many calories does walking burn?
The estimate depends on pace, body weight, incline, terrain, and time. At 155 pounds, 30 minutes is roughly 140 calories at 2.8–3.4 mph and 177 calories at 3.5–3.9 mph.
How many calories does running burn?
At 155 pounds, the MET method estimates about 314 calories for 30 minutes at 5 mph and 343 calories at 6 mph. Personal running economy changes the result.
Are smartwatch calorie estimates accurate?
They are useful estimates but not direct measurements. Device fit, heart rate, activity recognition, age, fitness, medicines, heat, and the manufacturer’s algorithm all affect the number.
Why do two exercise machines show different calorie totals?
Machines may use different formulas, resistance calibration, weight inputs, heart-rate data, and definitions of active versus total calories.
Can I subtract exercise calories from food calories exactly?
No. Both food intake and exercise expenditure contain error, and the body can change appetite and other daily movement. Use estimates as planning tools rather than exact offsets.
Do strength workouts burn fewer calories than cardio?
Many lifting sessions have a lower per-minute MET than continuous vigorous cardio, but intensity, rest, muscle recruitment, and post-exercise recovery vary. Strength training also provides benefits not captured by workout calories.
Does sweating mean I burned more calories?
Sweating mainly reflects heat regulation. Temperature, humidity, clothing, hydration, and individual sweat rate can increase sweating without a proportional rise in calorie expenditure.
Should children use an adult calorie burn chart?
Adult MET values are not ideal clinical targets for children. Youth energy cost, growth, and activity patterns differ, so age-specific guidance is more appropriate.
When should I stop exercising despite a calorie goal?
Stop and seek appropriate help for chest pain, fainting, severe or unusual breathlessness, confusion, new neurologic symptoms, severe palpitations, or a significant injury.
Sources
The activity values, intensity definitions, calculator method, and safety context draw from the following exercise-science and public-health resources.
1. Compendium of Physical Activities
2024 Adult Compendium of Physical Activities
Current adult activity codes and MET values used to build the activity estimates on this page.
https://pacompendium.com/adult-compendium/
2. Centers for Disease Control and Prevention
How to Measure Physical Activity Intensity
Guidance on light, moderate, and vigorous intensity, relative effort, the talk test, and MET categories.
https://www.cdc.gov/physical-activity-basics/measuring/index.html
3. Centers for Disease Control and Prevention
Adult Activity: An Overview
Weekly activity recommendations and the role of aerobic and muscle-strengthening exercise.
https://www.cdc.gov/physical-activity-basics/guidelines/adults.html
4. Clinical Cardiology / PubMed
Metabolic Equivalents in Exercise Testing, Exercise Prescription, and Evaluation of Functional Capacity
Foundational explanation of the MET as a practical expression of activity energy cost relative to rest.
https://pubmed.ncbi.nlm.nih.gov/2204507/
5. U.S. Department of Health and Human Services
Physical Activity Guidelines for Americans, Second Edition
Federal guidance on activity volume, intensity, health benefits, and safe progression.
https://health.gov/sites/default/files/2019-09/Physical_Activity_Guidelines_2nd_edition.pdf