Finance & Money
Dividend Yield Chart
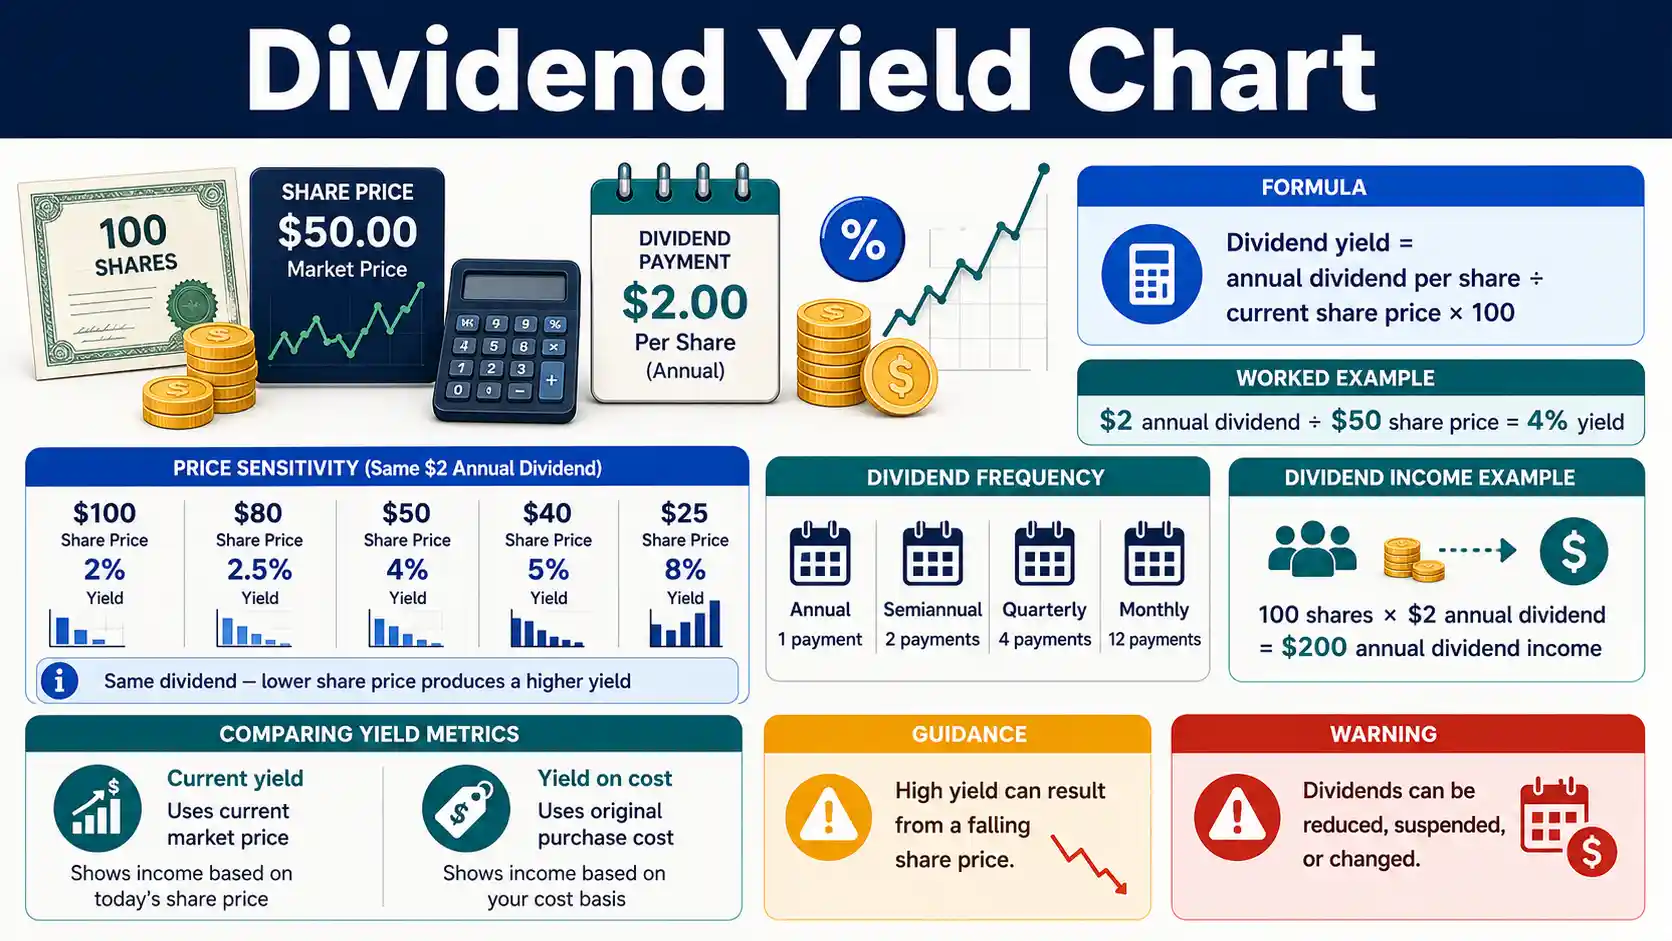
Dividend yield shows how much annual dividend income a security currently pays relative to its share price. Calculate it by dividing annual dividend per share by current share price and multiplying by 100.
Dividend yield is an income metric, not a safety score or expected total return. A high yield can be created by a falling share price, and future distributions can change.
Core formula
Annual dividend ÷ price
Divide the annual dividend per share by the current share price and multiply by 100 to express the result as a percentage.
Income formula
Shares × annual dividend
Multiply shares owned by the annual dividend per share to estimate gross annual cash income before taxes and future changes.
Price effect
Yield moves opposite price
When the dividend is unchanged, a lower share price raises dividend yield and a higher share price lowers it.
Critical limit
Dividend is not guaranteed
A company or fund can change, reduce, suspend, or replace a distribution, so verify the latest declaration and disclosures.
Direct answers to common dividend yield questions
What is dividend yield?
Dividend yield is the annual dividend per share divided by the current share price, expressed as a percentage.
How do you calculate a 4% dividend yield?
A $2 annual dividend on a $50 share equals a 4% dividend yield because $2 ÷ $50 × 100 = 4%.
How do you annualize a quarterly dividend?
Multiply a regular quarterly dividend by four before dividing by the current share price.
How do you estimate dividend income?
Multiply shares owned by the annual dividend per share. One hundred shares paying $2 annually produce $200 of gross annual dividend income if the rate continues.
Why can dividend yield rise after a stock falls?
A lower share price makes an unchanged dividend a larger percentage of price, so yield can rise even when the business outlook has weakened.
Is a high dividend yield always better?
No. A high yield can reflect a large distribution, a depressed share price, or both, so sustainability and business risk still need review.
What is yield on cost?
Yield on cost divides the current annual dividend by the investor's original purchase cost per share rather than by the current market price.
Is dividend yield the same as total return?
No. Dividend yield measures dividend income relative to price, while total return also includes share-price gains or losses over a defined period.
What happens on the ex-dividend date?
For an ordinary cash dividend, buying on or after the ex-dividend date generally means the buyer will not receive that next dividend payment.
Can a dividend be cut?
Yes. A prior dividend does not guarantee the same future payment, so forward income estimates should use the latest issuer information.
Are all dividends taxed the same way?
No. U.S. tax treatment can differ between ordinary and qualified dividends, and qualified treatment depends on IRS requirements including holding periods.
Should special dividends be included in forward yield?
A one-time special dividend should not automatically be treated as recurring income; label the yield method and the distributions included.
Dividend Yield Reference Chart
These examples show the arithmetic relationship between annual dividend per share, current share price, and dividend yield. They are examples, not target yields or investment recommendations.
Swipe horizontally inside the table to view every column.
| Annual dividend per share | Current share price | Dividend yield | Interpretation |
|---|---|---|---|
| $0.50 | $50 | 1.00% | Each $50 share currently represents $0.50 of annual dividend income |
| $1.00 | $50 | 2.00% | Each $50 share currently represents $1.00 of annual dividend income |
| $2.00 | $50 | 4.00% — Illustrative four percent yield | Each $50 share currently represents $2.00 of annual dividend income |
| $3.00 | $50 | 6.00% | Each $50 share currently represents $3.00 of annual dividend income |
| $4.00 | $50 | 8.00% | Each $50 share currently represents $4.00 of annual dividend income |
| $5.00 | $50 | 10.00% | Each $50 share currently represents $5.00 of annual dividend income — High yield requires additional risk review |
Dividend yield = annual dividend per share ÷ current share price × 100.
- • A higher yield can come from a larger dividend, a lower share price, or both.
- • A quoted annual dividend can change after a company increases, reduces, suspends, or declares a special distribution.
- • Dividend yield does not include share-price gains or losses, so it is not the same as total return.
Download or export
Dividend yield is annual income divided by current price
The Investor.gov dividend-yield definition frames yield as the dividend relative to market price. That denominator matters: the same annual dividend produces different yields as the share price changes.
Dividend Yield Formula Chart
Use the formula that matches the question you are answering. Current dividend yield uses current price, while yield on cost uses the investor's own purchase cost.
Swipe horizontally inside the table to view every column.
| Metric | Formula | What it measures | Main limitation |
|---|---|---|---|
| Current dividend yield | Annual dividend per share ÷ current share price × 100 — Core dividend yield formula | Annual dividend relative to today's market price | Changes whenever price or dividend changes |
| Annual dividend per share | Dividend per payment × payments per year | Annualized cash distribution per share | Irregular or special dividends may not repeat |
| Annual dividend income | Shares owned × annual dividend per share | Expected annual cash dividend before taxes | Assumes the dividend continues at the annualized rate |
| Yield on cost | Annual dividend per share ÷ original cost per share × 100 | Current annual dividend relative to historical purchase cost | Not a current-market valuation metric — Yield on cost is not current yield |
| Dividend payout ratio | Dividends ÷ earnings × 100 | Share of earnings distributed as dividends | Earnings can be volatile or negative |
| Total return | Price return + distributions, with reinvestment method stated | Combined investment performance | Requires a defined time period and reinvestment assumptions |
Use consistent per-share amounts and convert percentages to decimals where required in calculations.
- • Do not divide a quarterly dividend by price without annualizing it when you intend to calculate annual dividend yield.
- • Yield on cost can be useful for personal cash-flow history but should not replace current yield when comparing securities at today's prices.
- • Total return and dividend yield answer different questions.
Download or export
Dividend Payment Frequency and Annualization Chart
Annualize a regular cash dividend before comparing yield. Payment schedules vary by issuer and can change.
Swipe horizontally inside the table to view every column.
| Payment frequency | Payments per year | Example payment per share | Annualized dividend per share |
|---|---|---|---|
| Annual | 1 | $1.20 | $1.20 |
| Semiannual | 2 | $0.60 | $1.20 |
| Quarterly | 4 | $0.30 | $1.20 — Quarterly annualization example |
| Monthly | 12 | $0.10 | $1.20 |
| Irregular | Varies | Varies | Use declared or trailing distributions with the method clearly labeled |
| Special dividend | One-time or unusual | Issuer-specific | Do not automatically assume it will repeat next year — Special dividend may not repeat |
Annualized dividend = regular dividend per payment × expected number of payments per year.
- • Quarterly is common for U.S. corporations, but payment frequency is not universal.
- • Funds and companies can change or suspend distributions.
- • Trailing, indicated, and forward yields can differ because they use different dividend inputs.
Download or export
Share Price and Dividend Yield Sensitivity Chart
This example holds the annual dividend at $2.00 per share and changes only the current market price to show why yield can rise after a price decline.
Swipe horizontally inside the table to view every column.
| Current share price | Annual dividend per share | Dividend yield | What changed |
|---|---|---|---|
| $100 | $2.00 | 2.00% | Higher price produces lower yield when the dividend is unchanged |
| $80 | $2.00 | 2.50% | Price declined while annual dividend stayed constant |
| $60 | $2.00 | 3.33% | Price declined further |
| $50 | $2.00 | 4.00% — Four percent arithmetic example | Dividend is unchanged; denominator is smaller |
| $40 | $2.00 | 5.00% | Higher yield may reflect lower market valuation or greater perceived risk |
| $25 | $2.00 | 8.00% | A very large yield caused by a price drop needs sustainability review — High yield can be driven by price decline |
Illustrative arithmetic only; no row represents a recommended price or yield.
- • FINRA notes that yield generally falls when price rises and rises when price falls, all else equal.
- • A falling price can signal changing expectations about the company, including concerns about whether the dividend will continue.
- • Always review the issuer's earnings, cash flow, debt, distribution history, and disclosures instead of judging a stock by yield alone.
Download or export
A rising yield can be a price signal, not an income improvement
FINRA explains that stock and fund yield can be calculated as the yearly dividend rate divided by current price, and that yield typically rises when price falls if the dividend is unchanged. Read the FINRA investment-value guidance alongside company-specific disclosures when a yield changes sharply.
Browser-only educational tool
Dividend Yield and Income Calculator
Enter a current share price, dividend per payment, payment frequency, share count, and original cost per share. The calculator annualizes the dividend and separates current yield from yield on cost.
Current dividend yield
4.00%
$2.00 annual dividend ÷ $50.00 current price.
Estimated annual income
$200.00
100 shares × $2.00 annual dividend per share.
Yield on cost
5.00%
Uses $40.00original cost per share, not today's market price.
Annual dividend per share: $0.50 × 4 = $2.00
Current market value: 100 × $50.00 = $5,000.00
Average monthly equivalent: $200.00 ÷ 12 = $16.67
Current yield: $2.00 ÷ $50.00 × 100 = 4.00%
This tool annualizes the entered dividend as though the stated payment repeats. Companies and funds can change distributions, and share prices move continuously. Verify the latest declaration and quote before relying on the result.
Dividend Income by Share Count Chart
This example uses a $2.00 annual dividend per share. Dividend income scales with shares owned, but future payments are not guaranteed.
Swipe horizontally inside the table to view every column.
| Shares owned | Annual dividend per share | Estimated annual dividend income | Average monthly equivalent |
|---|---|---|---|
| 10 | $2.00 | $20 | $1.67 |
| 50 | $2.00 | $100 | $8.33 |
| 100 | $2.00 | $200 — One hundred shares example | $16.67 |
| 250 | $2.00 | $500 | $41.67 |
| 500 | $2.00 | $1,000 | $83.33 |
| 1,000 | $2.00 | $2,000 | $166.67 |
Annual income = shares owned × annual dividend per share. Monthly equivalent divides annual income by 12 and does not imply monthly payments.
- • Cash payments follow the issuer's actual payment schedule rather than arriving evenly each month.
- • Reinvested dividends buy additional shares instead of remaining as cash, and future share counts can therefore change.
- • Taxes, withholding, account type, and fees can affect spendable cash.
Download or export
Dividend Declaration, Ex-Date, Record, and Payment Chart
Dividend dates determine entitlement and payment timing. Check the issuer announcement and exchange information for the specific distribution.
Swipe horizontally inside the table to view every column.
| Date or event | What it means | Investor question | Important point |
|---|---|---|---|
| Declaration date | Company announces the dividend and key terms | Was a dividend actually declared? | A historical payment does not guarantee a new declaration |
| Ex-dividend date | Trading date used to determine entitlement to the next dividend | Will a buyer receive the next dividend? | Buying on or after the ex-dividend date generally means the buyer does not receive that cash dividend — Ex-date controls ordinary cash-dividend entitlement |
| Record date | Date the company uses to identify shareholders of record | Who is listed for the distribution? | Exchange settlement rules help determine the ex-date relative to the record date |
| Payment date | Date the dividend is scheduled to be paid | When is cash or stock distributed? | Broker processing can affect when a payment appears in an account |
| Special dividend | Large or unusual distribution | Do normal ex-date assumptions apply? | Special rules can apply, especially to very large distributions — Special rules may apply |
Dates are issuer- and distribution-specific. Use the current declaration for exact timing.
- • Investor.gov states that buying on the ex-dividend date or after generally means the buyer will not receive the next dividend.
- • Special dividends and stock dividends can follow different ex-date procedures.
- • Do not buy solely to capture a dividend without considering price changes, taxes, trading costs, and the investment's broader risk.
Download or export
Dividend tax labels and holding periods matter
U.S. tax reporting distinguishes ordinary and qualified dividends. The IRS Publication 550 explains that qualified treatment depends on requirements including the payer, dividend type, and holding period. Use Form 1099-DIV and current tax instructions for an actual return.
Dividend Yield Mistakes and Risk Checks
Dividend yield is a useful income metric, but it can be misleading when the dividend input, price, tax treatment, or sustainability assumptions are wrong.
Swipe horizontally inside the table to view every column.
| Mistake or warning sign | Why it matters | Better check | What to verify |
|---|---|---|---|
| Treating the highest yield as the best investment | A high yield can result from a sharp price decline — High yield can reflect price weakness | Review business quality and dividend sustainability | Earnings, cash flow, debt, payout policy, recent filings |
| Using one quarterly payment as an annual dividend | Understates or misstates annual yield unless annualized correctly | Multiply a regular quarterly payment by four | Payment frequency and any special dividends |
| Using old share price data | Current yield changes with market price | Use a price from the same valuation timestamp | Price source and timestamp |
| Confusing yield on cost with current yield | Historical purchase cost is not today's market price | Use current price for current yield | Which denominator the quoted percentage uses |
| Ignoring dividend cuts or suspensions | Forward income can fall quickly | Check the latest declaration and issuer disclosures — Verify the latest dividend declaration | Current dividend rate and declaration status |
| Ignoring taxes | Spendable income can differ from gross dividends | Review Form 1099-DIV and account-specific tax treatment | Ordinary versus qualified dividend classification and holding period |
| Ignoring total return | Price losses can exceed dividend income | Evaluate income and capital change together | Time period, reinvestment, fees, and price return |
This table describes due-diligence questions, not a scoring system or recommendation.
- • Qualified dividend treatment depends on specific IRS requirements and holding periods.
- • Brokerage estimates of annual income or yield can differ from realized future payments.
- • A dividend can be changed, reduced, suspended, or replaced by another capital-allocation decision.
Download or export
Limits, special cases, and when a yield needs more context
Trailing versus forward yield
Trailing yield uses historical distributions, while forward or indicated yield may annualize a recent regular payment. They can diverge after a dividend change or special distribution.
Funds, REITs, preferred shares, and special distributions
Distribution composition, frequency, return of capital, capital-gain distributions, preferred terms, and tax treatment can make a simple common-stock yield comparison incomplete.
Currency and withholding
Foreign dividends can involve exchange-rate changes, withholding taxes, treaty rules, and different reporting. Gross yield can therefore differ from cash received.
Business sustainability
Yield alone does not show whether the issuer can sustain its distribution. Review current earnings, cash flow, debt, capital needs, payout policy, and issuer filings.
A sudden double-digit yield after a large price decline deserves extra review. The dividend may continue, but the market price can also reflect deteriorating fundamentals or expectations of a future cut.
Frequently asked questions
What is dividend yield?
Dividend yield is the annual dividend per share divided by the current share price, expressed as a percentage. It measures dividend income relative to today's price.
How do you calculate dividend yield?
Divide the annual dividend per share by the current share price and multiply by 100. A $2 annual dividend on a $50 share equals a 4% yield.
How do you annualize a quarterly dividend?
Multiply a regular quarterly dividend by four before calculating annual yield. Do not assume a special dividend will repeat.
Does a higher dividend yield mean a better stock?
No. A higher yield can result from a larger dividend or a falling share price, so yield must be evaluated with business quality, cash flow, debt, and dividend sustainability.
Why does dividend yield rise when a stock price falls?
If the annual dividend stays unchanged, a lower share price makes the dividend a larger percentage of that price. The higher yield can therefore reflect price weakness rather than improved income quality.
What is yield on cost?
Yield on cost divides the current annual dividend by your original purchase cost per share. It describes your historical position, not the security's current market yield.
Is dividend yield the same as total return?
No. Dividend yield measures annual dividend income relative to price, while total return also includes the investment's price gain or loss over a stated period.
How do I estimate annual dividend income?
Multiply the number of shares you own by the annual dividend per share. The result is a gross estimate before taxes, withholding, fees, and future dividend changes.
What is the ex-dividend date?
The ex-dividend date is the trading date used to determine entitlement to the next dividend. For an ordinary cash dividend, buying on or after the ex-date generally means the buyer does not receive that payment.
Can a company cut or stop its dividend?
Yes. A dividend is not guaranteed simply because the company paid one previously, so use the latest declaration and issuer disclosures when estimating future income.
What is a qualified dividend?
A qualified dividend is an ordinary dividend that meets IRS requirements for preferential capital-gain tax rates. The payer, dividend type, and required holding period all matter.
What holding period applies to many qualified common-stock dividends?
IRS Publication 550 generally requires more than 60 days of holding during the 121-day period beginning 60 days before the ex-dividend date, subject to additional rules and exceptions.
Should a special dividend be included in forward yield?
Usually not unless there is a sound reason to expect it to recur. Label trailing, indicated, and forward yield methods so users know which distributions are included.
How often are dividends paid?
Payment frequency depends on the issuer. Dividends can be annual, semiannual, quarterly, monthly, irregular, or one-time special distributions.
Can dividend income be reinvested?
Yes. A dividend reinvestment plan can use distributions to buy additional shares, but reinvested dividends can still have tax consequences in a taxable account.
Sources
These investor-education and tax resources support the yield formula, price relationship, dividend-date explanations, and U.S. dividend tax distinctions shown on this page.
Investor.gov — Dividend Yield Glossary
https://www.investor.gov/introduction-investing/investing-basics/glossary/dividend-yield
Defines dividend yield as a percentage measure that relates annual dividends to the current share price.
FINRA — Defining the Value of an Investment
https://www.finra.org/investors/insights/defining-value-investment
Explains that stock and fund yield can be calculated as yearly dividend rate divided by current price and that price changes can move yield in the opposite direction.
Investor.gov — Ex-Dividend Dates: When Are You Entitled to Stock and Cash Dividends
https://www.investor.gov/introduction-investing/investing-basics/glossary/ex-dividend-dates-when-are-you-entitled-stock-and
Explains record dates, ex-dividend dates, payable dates, and who is entitled to a declared dividend.
Internal Revenue Service — Publication 550, Investment Income and Expenses
https://www.irs.gov/publications/p550
Explains ordinary and qualified dividends, Form 1099-DIV reporting, and the holding-period rule that applies to many qualified dividends.
Internal Revenue Service — Topic No. 404, Dividends and Other Corporate Distributions
https://www.irs.gov/taxtopics/tc404
Explains ordinary versus qualified dividends and common Form 1099-DIV reporting categories.