Health & Medical · Vision reference
Eye Chart: Snellen, Metric and logMAR Visual Acuity
Compare common eye-chart lines, convert Snellen notation to metric, decimal, and logMAR values, learn how testing distance changes accuracy, and understand why a visual-acuity chart is only one part of an eye examination.
Do not use a printable chart to diagnose eye disease, prescribe lenses, or delay urgent care. Sudden vision loss, a curtain or shadow, severe eye pain, injury, chemical exposure, or new neurologic symptoms need urgent assessment. Read the ChartsLoom Disclaimer.
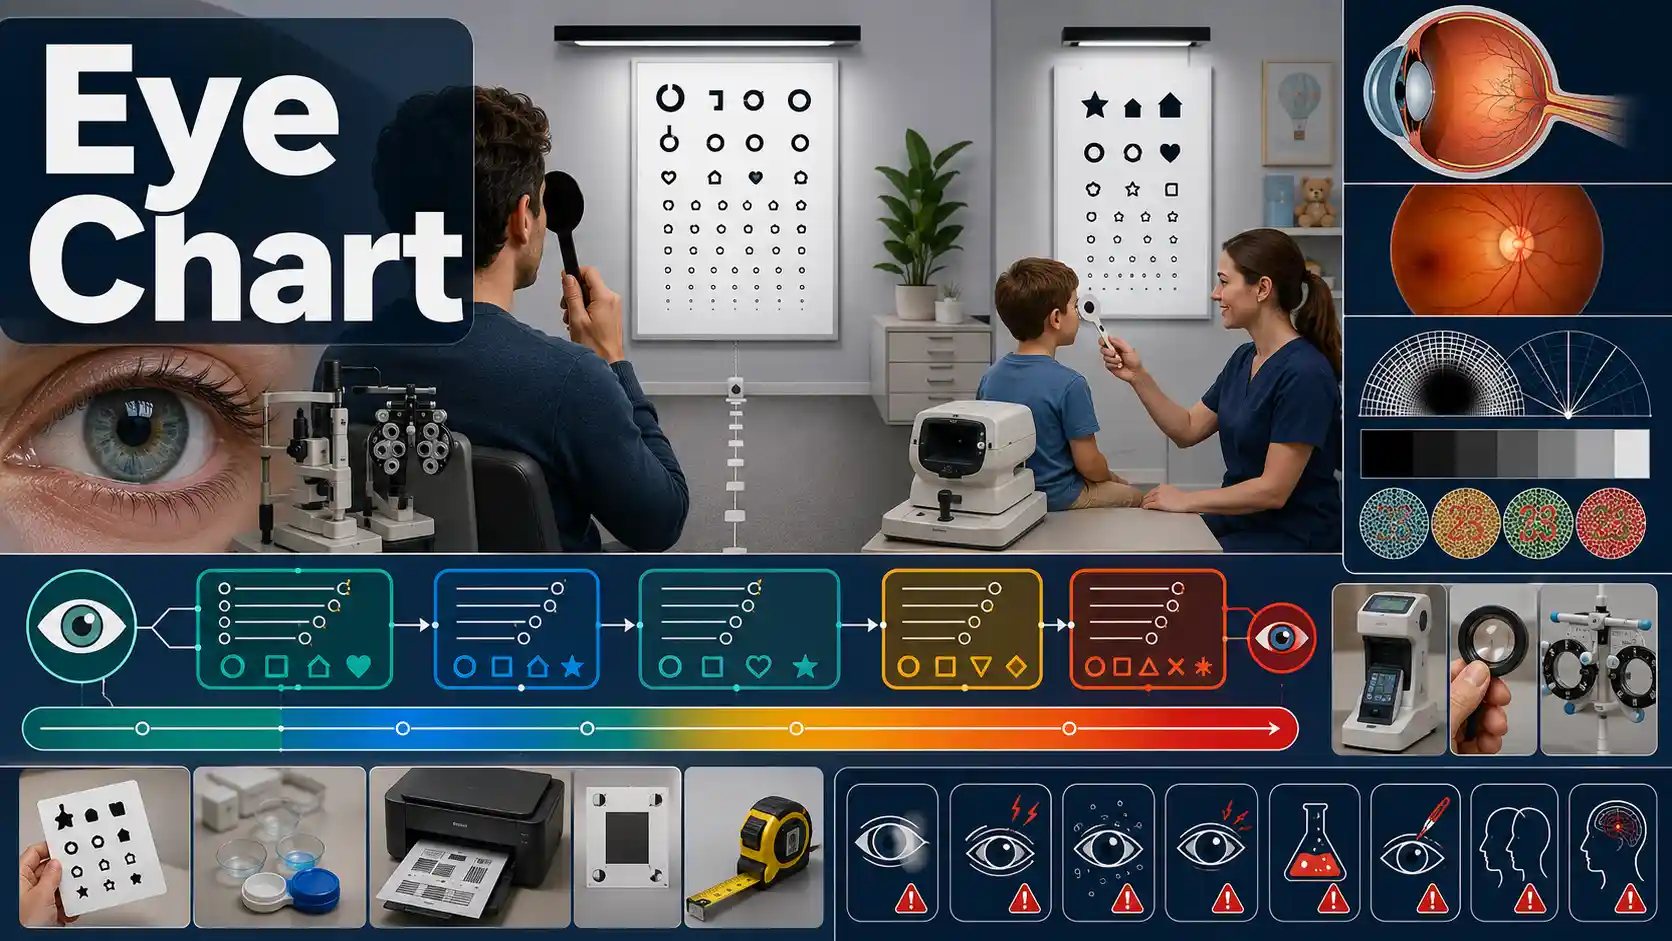
What does an eye chart tell you?
An eye chart measures central high-contrast visual acuity at a specified distance. In 20/40 vision, you read at 20 feet what a reference observer can read at 40 feet.
The American Academy of Ophthalmology eye-chart guide explains that the top number is the testing distance and the lower number represents the reference distance for the same line. A result such as 20/20 describes sharpness under those conditions; it does not test peripheral vision, color, contrast, depth perception, eye pressure, or retinal and optic-nerve health.
- Reference acuity
- 20/20 · 6/6
- logMAR equivalent
- 0.00
- Test each eye
- Separately
- Home-chart role
- Screening only
A central distance-acuity reference, not perfect vision.
Lower logMAR values represent finer measured acuity.
One eye can compensate for a weaker fellow eye.
It cannot prescribe lenses or assess complete eye health.
Snellen, Metric, Decimal and logMAR Conversion Chart
Approximate conversions among common distance visual-acuity notations. Individual charts may use slightly different line steps or scoring rules.
Swipe horizontally inside the table to view every column.
| Snellen (feet) | Metric | Decimal acuity | Approx. logMAR | Relative to 20/20 |
|---|---|---|---|---|
| 20/10 | 6/3 | 2.00 | −0.30 | Better than the 20/20 reference |
| 20/12.5 | 6/3.8 | 1.60 | −0.20 | Better than the 20/20 reference |
| 20/16 | 6/4.8 | 1.25 | −0.10 | Better than the 20/20 reference |
| 20/20 — Standard reference | 6/6 | 1.00 | 0.00 | Standard reference acuity |
| 20/25 | 6/7.5 | 0.80 | 0.10 | Slightly below the 20/20 reference |
| 20/32 | 6/9.5 | 0.63 | 0.20 | Reduced distance acuity |
| 20/40 — Reduced acuity | 6/12 | 0.50 | 0.30 | Reads at 20 ft what reference vision reads at 40 ft |
| 20/50 | 6/15 | 0.40 | 0.40 | Reduced distance acuity |
| 20/63 | 6/19 | 0.32 | 0.50 | Reduced distance acuity |
| 20/80 | 6/24 | 0.25 | 0.60 | Substantial reduction on a distance chart |
| 20/100 | 6/30 | 0.20 | 0.70 | Substantial reduction on a distance chart |
| 20/125 | 6/38 | 0.16 | 0.80 | Marked reduction on a distance chart |
| 20/160 | 6/48 | 0.125 | 0.90 | Marked reduction on a distance chart |
| 20/200 — Severe reduction | 6/60 | 0.10 | 1.00 | Severe reduction; legal definitions require more context |
| 20/400 | 6/120 | 0.05 | 1.30 | Very severe reduction on a distance chart |
Snellen is a distance fraction; decimal acuity is numerator ÷ denominator; logMAR is approximately log10(denominator ÷ numerator).
- • These are mathematical notation conversions, not diagnoses or predictions of daily functioning.
- • Acuity should be recorded for each eye, with testing distance, correction status, chart type, and scoring method.
- • A professional result may be letter-scored between lines rather than rounded to the nearest full line.
Download or export
Visual acuity is a distance ratio, not a percentage
In a result such as 20/40, the first number is the test distance. The second is the distance at which a reference observer can read the same detail. Larger denominators indicate lower measured acuity.
How to Read a Snellen Eye-Chart Result
The fraction describes distance visual acuity under the test conditions. It does not summarize the full health or performance of the visual system.
Swipe horizontally inside the table to view every column.
| Part of result | Meaning | Example | Important limitation |
|---|---|---|---|
| Top number | Testing distance from the chart | 20 feet or an optical equivalent | A wrong distance invalidates the result |
| Bottom number | Distance at which a reference observer reads the same line | 40 in 20/40 | It is not a percentage of vision remaining |
| Right eye | Acuity measured with the left eye covered | OD on some records | Each eye must be tested separately |
| Left eye | Acuity measured with the right eye covered | OS on some records | Do not press on the covered eye |
| With correction | Result while wearing the intended glasses or contacts | Corrected acuity | Record whether correction was worn |
| Without correction | Result without glasses or contacts | Uncorrected acuity | Does not show best-corrected potential |
| Pinhole result | A quick check that may improve blur from refractive error | Acuity through a pinhole | Does not replace refraction or an eye exam |
| Missed letters | Letter-level score near a chart line | 20/25 −2 | Scoring conventions differ by chart and clinic |
- • 20/20 is a reference for central distance sharpness, not a guarantee of perfect or healthy vision.
- • Testing conditions, squinting, memorization, fatigue, dry eye, lighting, and chart calibration can affect performance.
Download or export
20/20 does not mean perfect vision
The AAO explanation of 20/20 vision notes that people can have sharper-than-20/20 acuity, and that an ordinary chart does not describe all visual abilities. Good central acuity can coexist with peripheral-field loss, low contrast, poor color discrimination, or eye disease.
Eye-Chart Types and What They Test
Different optotypes and scoring systems are used for adults, children, non-readers, research, low vision, distance vision, and near vision.
Swipe horizontally inside the table to view every column.
| Chart or optotype | Typical use | Response required | Key strength | Limitation |
|---|---|---|---|---|
| Snellen letters | Routine distance acuity | Name letters | Familiar and widely used | Unequal letters and line spacing can reduce precision |
| ETDRS / logMAR | Clinical trials and precise monitoring | Name letters | Equal letter spacing and regular line progression | Needs standardized distance and scoring |
| Tumbling E | People who cannot name letters | Point to the E direction | Language-independent directional response | Direction concepts may still be difficult |
| Landolt C | Standardized acuity testing | Identify the gap direction | Geometrically controlled optotype | Requires directional understanding |
| HOTV | Young children | Match or name H, O, T, V | Small letter set supports matching | Chance guessing is higher than on larger sets |
| LEA Symbols | Preschool and developmental testing | Name or match simple symbols | Child-friendly and language adaptable | Must use the calibrated symbol chart |
| Near-vision card | Reading acuity at a specified near distance | Read words, letters, or symbols | Assesses near task performance | Distance and print system must be recorded |
| Contrast-sensitivity chart | Seeing low-contrast detail | Identify fading letters or gratings | Adds information beyond high-contrast acuity | Not interchangeable with Snellen acuity |
- • Use a chart designed for the person’s age, literacy, language, and communication ability.
- • Near and distance acuity are separate measurements and should not be converted as though they were identical tests.
Download or export
How to Use a Printable Eye Chart More Reliably
A home chart can identify a possible change only when the file, print scale, testing distance, lighting, occlusion, and correction are controlled.
Swipe horizontally inside the table to view every column.
| Step | What to do | Why it matters | Common error |
|---|---|---|---|
| 1. Use a calibrated file | Use the chart and instructions from a credible eye-health source | Optotype size must match the intended distance | Using an arbitrary online image |
| 2. Print at exact scale | Disable fit-to-page and confirm any printed size marker | Automatic scaling changes every acuity line | Printer shrinks or enlarges the page |
| 3. Mount at eye level | Place the chart flat on a well-lit wall | Angle and glare affect recognition | Holding a wrinkled chart by hand |
| 4. Measure the distance | Measure from the eyes to the chart exactly | The Snellen fraction depends on test distance | Estimating distance by room size |
| 5. Test usual correction | Wear distance glasses or contacts when evaluating corrected vision | Correction status changes interpretation | Switching correction between eyes |
| 6. Cover one eye gently | Use an occluder or clean card without pressing | Each eye needs an independent result | Peeking or pressing on the eye |
| 7. Read from large to small | Continue until the line-scoring rule is not met | Standard sequence reduces guessing bias | Starting on a memorized small line |
| 8. Repeat the other eye | Use the same lighting, distance, and correction | Makes the two eyes comparable | Changing room conditions |
| 9. Record conditions | Write eye, chart, distance, correction, line, and symptoms | Supports meaningful comparison or follow-up | Recording only one fraction |
- • Home results are screening information and should not be used to prescribe glasses, contacts, treatment, or driving fitness.
- • Stop testing and seek urgent care for sudden vision loss, a curtain or shadow, severe pain, injury, chemical exposure, or neurologic symptoms.
Download or export
Visual-acuity notation converter
Enter a Snellen or metric fraction to estimate equivalent notation, decimal acuity, and logMAR. The description is deliberately broad because a chart result cannot identify the cause of reduced vision.
20/20 · 6/6
Decimal acuity 1.00 · approximate logMAR 0.00
General chart description
20/20-equivalent or better reference acuity. This does not determine diagnosis, disability status, driving eligibility, or treatment.
Child Vision Screening and Eye-Chart Readiness
Children need age-appropriate screening because one eye may be weaker even when the child does not complain or appear to have difficulty seeing.
Swipe horizontally inside the table to view every column.
| Stage | Useful screening approach | What caregivers may notice | When to arrange evaluation |
|---|---|---|---|
| Newborn period | Red reflex and basic eye examination by a clinician | Cloudy pupil, unusual eye appearance, poor light response | Promptly for an abnormal reflex or visible concern |
| Infancy | Age-appropriate fixation, alignment, movement, and risk assessment | Constant turning, shaking eyes, poor tracking, light sensitivity | Promptly for persistent signs or developmental concern |
| Toddler years | Instrument-based or symbol-based screening when available | One eye closing, head tilt, frequent bumping, eye rubbing | When screening is abnormal or symptoms persist |
| Ages 3–5 — At least one screening recommended | Vision screening at least once to detect amblyopia or risk factors | Squinting, sitting very close, avoiding visual tasks | Refer when the child cannot complete or does not pass screening |
| School age | Periodic acuity screening and symptom review | Headaches, losing place, difficulty seeing the board | For failed screening, symptoms, or school concerns |
| Any age with risk factors | Comprehensive eye evaluation rather than chart-only screening | Prematurity, family history, neurologic or developmental conditions | Follow the clinician’s individualized schedule |
| Sudden or severe symptoms | Urgent clinical assessment | Sudden loss, severe pain, injury, chemical exposure, new double vision | Urgent or emergency care |
- • A child may compensate with the stronger eye, so normal behavior does not rule out amblyopia or unequal vision.
- • Matching-symbol charts can be practised for the task, but the actual test line should not be memorized.
Download or export
Children can have unequal vision without complaining
The CDC child-vision guidance recommends age-appropriate screening, including at least one screening between ages 3 and 5. A failed or incomplete screen, eye turn, squinting, head tilt, headaches, or difficulty with visual tasks deserves follow-up.
What an Eye Chart Measures—and What It Misses
High-contrast central visual acuity is one part of a complete vision and eye-health assessment.
Swipe horizontally inside the table to view every column.
| Assessment | What it evaluates | Measured by an ordinary Snellen chart? | Why it matters |
|---|---|---|---|
| Distance visual acuity | Central sharpness at the chart distance | Yes — Measured by the chart | Quantifies recognition of high-contrast detail |
| Near visual acuity | Small print or symbols at a stated near distance | No | Near tasks and presbyopia need separate testing |
| Refraction | Lens power that gives best focus | No | Determines a glasses or contact-lens prescription |
| Visual field | Side and peripheral vision | No | Can be affected by glaucoma, retina, nerve, or brain disease |
| Contrast sensitivity | Detail when contrast is low | No | Can affect night driving, fog, faces, and stairs |
| Color vision | Color discrimination | No | May reveal inherited or acquired color defects |
| Eye pressure | Intraocular pressure | No | One component of glaucoma assessment |
| Dilated internal exam | Retina, macula, optic nerve, vessels, and lens | No | Can detect disease despite good chart acuity |
- • A person can read 20/20 and still have glaucoma, retinal disease, poor contrast sensitivity, color deficiency, or peripheral-field loss.
- • A comprehensive exam selects additional tests based on age, symptoms, health conditions, medicines, family history, and findings.
Download or export
Common Reasons an Eye-Chart Result May Be Reduced
Blur on an eye chart has many possible causes. The pattern, onset, symptoms, correction, examination, and health history determine the next step.
Swipe horizontally inside the table to view every column.
| Possible factor | Typical clue | Can glasses help? | Why an examination may be needed |
|---|---|---|---|
| Uncorrected refractive error | Distance or near blur that may improve through a pinhole | Often | Refraction identifies myopia, hyperopia, or astigmatism |
| Outdated or damaged correction | Vision changed since the current prescription | Often after reassessment | Frames, lenses, contacts, and eye health all need review |
| Dry eye or unstable tear film | Fluctuating blur, burning, grittiness, or screen-related symptoms | Not usually by prescription alone | Surface treatment and cause assessment may help |
| Cataract | Glare, halos, faded color, gradual blur | May not fully correct | Lens opacity and functional impact need examination |
| Amblyopia | One eye has reduced best-corrected acuity from childhood development | Not by lenses alone | Early detection and treatment are time-sensitive |
| Corneal disorder | Distortion, pain, light sensitivity, irregular astigmatism | Sometimes partly | Corneal shape, injury, infection, or scarring may require treatment |
| Retinal or macular disorder | Distortion, missing area, reduced central vision, flashes or floaters | Often not fully | Retinal examination and imaging may be urgent |
| Optic nerve or neurologic disorder | Color change, field loss, pain with movement, double vision, neurologic signs | Often not | May require urgent eye or neurologic assessment |
- • Common does not mean harmless: new, one-sided, rapidly changing, painful, distorted, or field-related symptoms need timely evaluation.
- • Refractive error and cataract are major causes of vision impairment globally, but an individual diagnosis requires examination.
Download or export
Reduced acuity has many possible causes
The World Health Organization vision-impairment overview identifies refractive error and cataract among the leading global causes, with glaucoma, diabetic retinopathy, and age-related macular degeneration also important. The same chart fraction can result from different conditions, so onset, symptoms, examination, and correction matter.
Eye and Vision Warning Signs
Urgency depends on onset, severity, symptoms, injury, and medical context—not only on the smallest line read on a chart.
Swipe horizontally inside the table to view every column.
| Warning sign | Possible concern | Suggested urgency | Do not rely on |
|---|---|---|---|
| Sudden vision loss or major new blur | Retina, optic nerve, blood flow, eye pressure, or neurologic emergency | Emergency assessment now — Emergency | A repeat home chart alone |
| Curtain, shadow, or missing side vision | Retinal detachment or visual-field loss | Emergency eye assessment — Emergency | Waiting for pain; retinal detachment may be painless |
| New flashes and many floaters | Vitreous change or retinal tear | Urgent same-day eye advice, especially with a shadow | A normal central eye-chart line |
| Severe eye pain, redness, halos, nausea | Acute pressure rise, inflammation, infection, or corneal problem | Urgent or emergency assessment | Driving yourself when vision is impaired |
| Chemical splash or penetrating injury | Potentially sight-threatening trauma | Immediate first aid and emergency care — Immediate care | Testing acuity before irrigation after a chemical splash |
| New double vision with weakness, speech change, or severe headache | Neurologic emergency | Emergency assessment | Covering an eye and delaying care |
| Painful red eye with contact-lens use | Corneal infection risk | Urgent same-day eye assessment | Continuing to wear the lens |
| Gradual persistent blur or one eye consistently worse | Refractive error or eye disease | Arrange a comprehensive examination | Repeated self-testing without follow-up |
- • Call local emergency services when sudden vision symptoms occur with facial droop, weakness, speech difficulty, severe headache, trauma, or loss of consciousness.
- • A normal home-chart result does not rule out retinal, optic-nerve, peripheral-field, pressure, or neurologic disease.
Download or export
Home Eye-Chart Limitations and Better Next Steps
A printable chart is useful for observing change, but several technical and clinical limitations prevent it from replacing professional testing.
Swipe horizontally inside the table to view every column.
| Limitation | How it can distort the result | Better practice | Professional follow-up |
|---|---|---|---|
| Incorrect print scale | Letters become too large or too small | Verify the calibration marker and 100% scale | Repeat with standardized equipment if concerned |
| Incorrect testing distance | Every Snellen line is misclassified | Measure from the eyes to the chart | Clinic lanes use calibrated distances or mirrors |
| Screen size or browser zoom | Digital optotypes change physical size | Use a validated screen test with calibration | Do not use an ordinary webpage as a prescription test |
| Uneven lighting or glare | Reduces contrast or creates reflections | Use even light without glare | A clinic controls illumination |
| Peeking, squinting, or pressing the eye | Can falsely improve or temporarily blur performance | Use a proper occluder and relaxed posture | Repeat under supervised conditions |
| Memorized letters | Recognition no longer reflects visual resolution | Use alternate charts or randomized optotypes | Clinics can change charts and letter sets |
| Only central acuity tested | Peripheral, color, contrast, and eye health remain unknown | Treat the chart as one screening measure | Comprehensive examination adds needed tests |
| No diagnosis from the fraction | Different diseases can produce similar acuity | Record symptoms and onset with the result | An eye professional identifies the cause |
- • Do not order prescription lenses from a home chart result alone.
- • Use the same setup for trend comparisons, but seek care for persistent asymmetry, decline, symptoms, or failed child screening.
Download or export
Eye-chart questions and direct answers
What does 20/20 vision mean?
It means that at 20 feet you can resolve the line a reference observer is expected to resolve at 20 feet. It describes central high-contrast distance acuity, not perfect vision or complete eye health.
Is 20/40 vision half as good as 20/20?
No. Snellen fractions are not percentages. A 20/40 result means you need to be 20 feet away to identify detail that the reference observer can identify at 40 feet.
Can someone see better than 20/20?
Yes. Results such as 20/16 or 20/10 indicate finer high-contrast distance acuity than the 20/20 reference under the test conditions.
Does 20/20 mean my eyes are healthy?
No. A person can read 20/20 while having peripheral-field loss, reduced contrast, color-vision problems, glaucoma, retinal disease, or other conditions not measured by a standard eye chart.
What is the metric equivalent of 20/20?
The commonly used metric equivalent is 6/6 because the test distance is expressed as 6 metres instead of 20 feet.
What is logMAR acuity?
logMAR expresses the logarithm of the minimum angle of resolution. On the common scale, 0.00 is approximately 20/20, negative values are better, and positive values indicate reduced acuity.
Should I test each eye separately?
Yes. One eye can compensate for the other. Cover each eye without pressing, keep the setup unchanged, and record the result for each eye.
Should glasses be worn during an eye-chart test?
Wear the correction used for the task when testing corrected vision, and record that it was worn. An uncorrected test answers a different question.
Can a printable eye chart prescribe glasses?
No. It can screen central acuity but cannot perform refraction, evaluate eye health, or determine a safe prescription.
Why does testing distance matter?
The physical letter size is designed for a specific distance. Standing closer or farther changes the visual angle and invalidates the printed Snellen labels.
When should children have vision screening?
Children should receive age-appropriate vision assessment throughout development, including at least one screening between ages 3 and 5. Risk factors, symptoms, or a failed screen require follow-up.
What is the difference between a distance and near eye chart?
A distance chart measures central acuity at a calibrated far distance. A near card measures reading or symbol acuity at a stated near distance; the two results are not interchangeable.
Can dry eyes change an eye-chart result?
Yes. An unstable tear film can cause fluctuating blur, especially during prolonged screen use or blinking changes. Persistent symptoms still warrant evaluation.
Which vision symptoms are emergencies?
Sudden loss, a curtain or shadow, flashes with many new floaters, severe eye pain, chemical or penetrating injury, and new double vision with neurologic symptoms require urgent or emergency assessment.
Sources
The URLs below are shown as plain text for transparent reference. Table source links above remain on this page and lead to these records.
1. American Academy of Ophthalmology — All About the Eye Chart
https://www.aao.org/eye-health/tips-prevention/eye-chart-facts-history
Explains Snellen testing distance, visual-acuity fractions, and what an eye chart measures.
2. American Academy of Ophthalmology — What Does 20/20 Vision Mean?
https://www.aao.org/eye-health/tips-prevention/what-does-20-20-vision-mean
Explains the 20/20 reference and why it does not represent every aspect of vision.
3. American Academy of Ophthalmology — Home Vision Tests for Children and Adults
https://www.aao.org/eye-health/tips-prevention/home-eye-test-children-adults
Provides home-test setup and emphasizes that home charts do not replace professional examinations.
4. Centers for Disease Control and Prevention — Keep an Eye on Your Child’s Vision
https://www.cdc.gov/vision-health/prevention/youth-vision-problems.html
Summarizes childhood vision screening and signs that merit evaluation.
5. World Health Organization — Blindness and Vision Impairment
https://www.who.int/news-room/fact-sheets/detail/blindness-and-visual-impairment
Provides global context on vision impairment and common causes such as refractive error and cataract.