Health & Medical · Pediatric growth monitoring reference
Growth Chart: Child Height, Weight, BMI and Percentiles
Choose the correct growth chart from birth through age 20, understand what percentiles mean, measure accurately, compare serial trends, and recognize when feeding or growth changes need medical assessment.
A growth chart is a screening and monitoring tool, not a diagnosis. One home measurement or percentile cannot determine whether a child is healthy. Seek prompt care for poor feeding, dehydration, weight loss, breathing difficulty, persistent vomiting, severe weakness, or other concerning symptoms. Read the ChartsLoom Disclaimer.
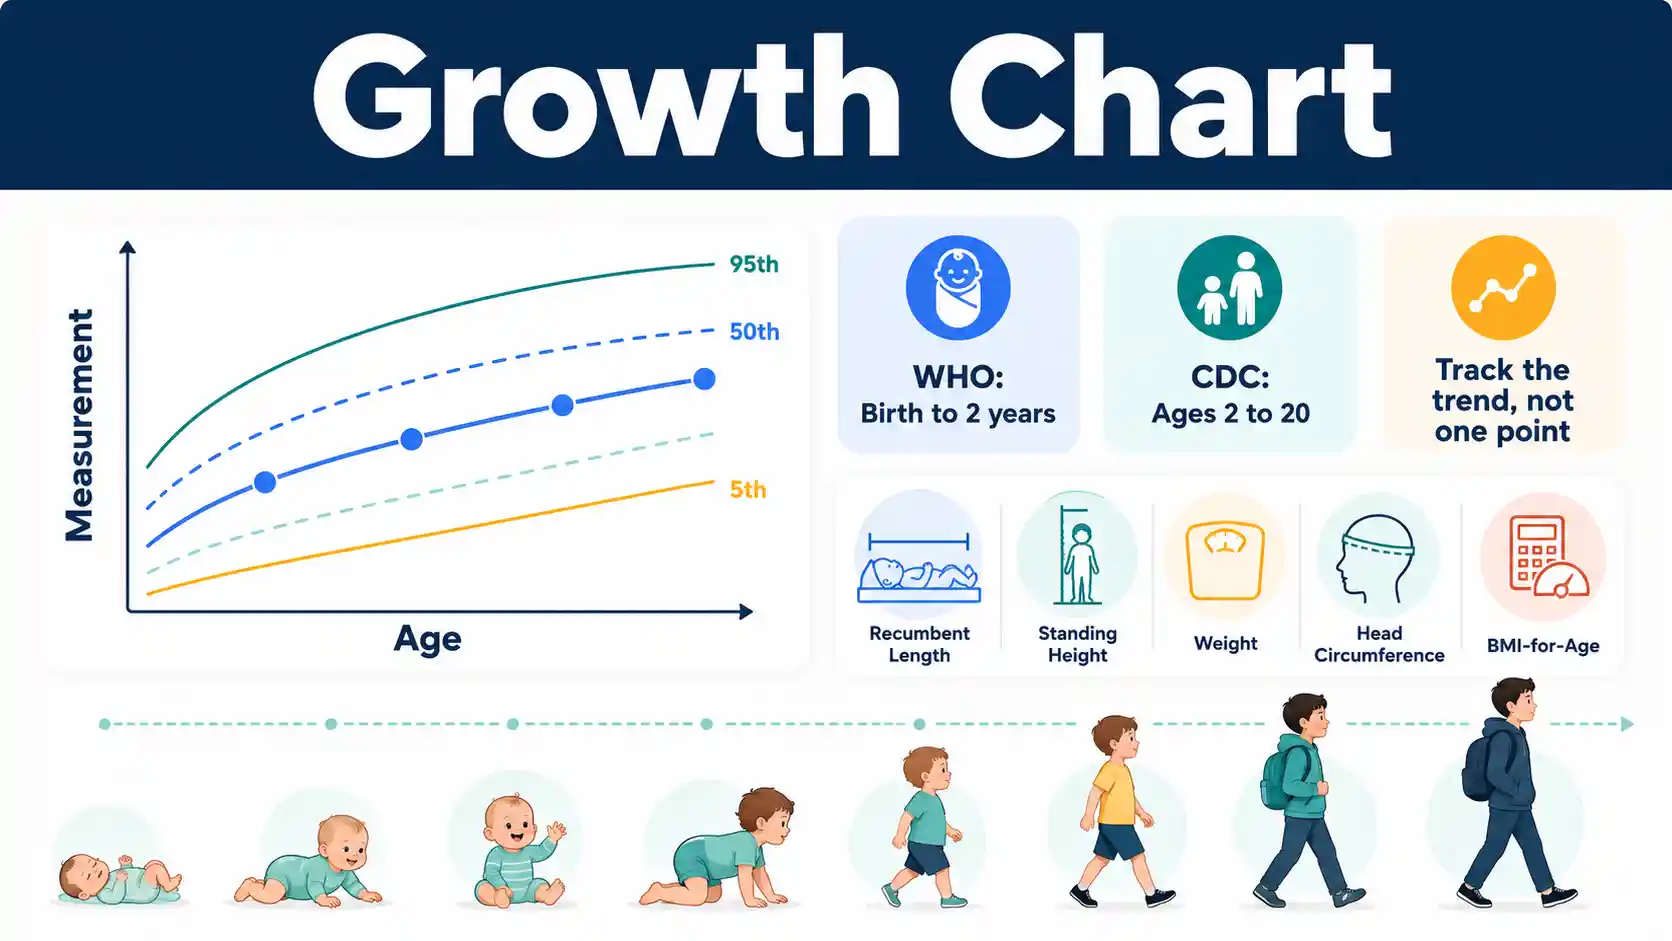
Which growth chart should be used?
Use WHO Child Growth Standards from birth to younger than 2 years and CDC Growth Charts from age 2 through 20 years in U.S. clinical practice. Plot the correct measure on a sex-specific chart using exact age and reliable technique.
CDC recommends WHO charts before age 2 and CDC charts afterward, with extended BMI-for-age curves for children and adolescents whose BMI is above the 97th percentile.
Birth to under 2
WHO charts
Plot weight, recumbent length, weight-for-length, and head circumference.
Age 2 to 20
CDC charts
Plot stature, weight, and BMI using exact age and a sex-specific chart.
Best signal
Serial trend
A connected pattern is usually more informative than one isolated percentile.
Clinical role
Screening tool
A growth chart supports assessment but cannot diagnose the cause of a change.
Which Growth Chart to Use by Age and Situation
The correct chart depends on age, measurement type, sex-specific reference, and clinical context. A chart change can alter percentile classification even when growth is unchanged.
Swipe horizontally inside the table to view every column.
| Age or situation | Recommended chart | Measurements commonly plotted | Key interpretation point |
|---|---|---|---|
| Birth to younger than 2 years | WHO Child Growth Standards | Weight-for-age, length-for-age, weight-for-length, head circumference-for-age | Use recumbent length and weight-for-length; infant BMI is not the recommended screening chart |
| At 24 months | Transition from WHO to CDC charts | Standing height, weight, and BMI-for-age | A percentile may shift because the chart, measurement posture, and index all change |
| Age 2 to 20 years | 2000 CDC Growth Charts | Stature-for-age, weight-for-age, BMI-for-age | Interpret repeated points over time with age, sex, puberty, family history, and health context |
| Age 2 to 20 years with BMI above the 97th percentile | 2022 CDC Extended BMI-for-Age Charts | BMI-for-age through very high BMI values | The extended curves improve tracking above the range of the original BMI chart |
| Preterm infant before and around term-equivalent age | Clinician-selected preterm chart, commonly Fenton | Weight, length, and head circumference by gestational age | Use gestational and corrected-age context rather than plotting only chronological age |
| Child with a condition affecting growth | Standard chart plus an appropriate condition-specific reference when available | Condition-dependent measurements | A specialty chart can add context but does not replace clinical assessment |
- • CDC and AAP recommend WHO growth standards for children from birth to 2 years and CDC growth charts from age 2 years onward in U.S. clinical practice.
- • Always choose the sex-specific chart and calculate age accurately to the measurement date.
- • Country-specific clinical guidance may recommend a different national reference while using the same principles of accurate serial measurement.
Download or export
How a growth curve works
Follow the connected pattern, not the nearest percentile label
Age runs from left to right and the measured value runs upward. Plot each reliable measurement, connect the points mentally, and review whether the child is following a consistent path or showing a confirmed change.
Growth Measurements and What Each One Shows
Each measurement answers a different question. Weight, length or height, head circumference, weight-for-length, and BMI should not be treated as interchangeable.
Swipe horizontally inside the table to view every column.
| Measurement | Typical age or use | What it helps assess | Important limitation |
|---|---|---|---|
| Weight-for-age | Birth through childhood | Body mass relative to age | Does not show whether weight is proportional to length or height |
| Length-for-age | Birth to younger than 2 years | Linear growth measured lying down | Movement, bent knees, or one-person technique can create error |
| Stature-for-age | Age 2 years and older | Standing linear growth | Shoes, posture, hair, flooring, and wall setup affect accuracy |
| Weight-for-length | Birth to younger than 2 years | Weight relative to recumbent length | A small length error can noticeably change the plotted result |
| BMI-for-age | Age 2 to 20 years | Weight relative to squared standing height, adjusted for age and sex | BMI is a screening measure and does not directly measure body fat or diagnose disease |
| Head circumference-for-age | Primarily birth to 2 years | Growth of head size over time | Tape placement and hair can distort the measurement; trends need clinical context |
| Growth velocity | Any age with repeated measurements | Rate of change between two reliable measurements | Short intervals magnify measurement error and should not be judged without age-specific context |
| Corrected-age growth | Former preterm infants | Growth relative to expected timing after prematurity | The correction period and chart transition should follow the child’s clinical plan |
- • Percentiles compare a measurement with a reference population of the same age and sex; they do not score health, intelligence, or future adult size.
- • Growth assessment is strongest when multiple measures are taken accurately at appropriate intervals.
Download or export
A percentile is a rank, while a growth trend is a pattern
A child does not need to be near the 50th percentile to be healthy. Look for reliable serial points, proportional growth, development, nutrition, family pattern, puberty timing, and symptoms rather than treating one percentile as a grade.
How to Read Growth Chart Percentiles
A percentile is a rank within the chart’s reference population. The pattern across time is usually more informative than whether one point is near the middle.
Swipe horizontally inside the table to view every column.
| Chart result or pattern | Plain-language meaning | What it does not mean | Best next step |
|---|---|---|---|
| 50th percentile | The measurement equals or exceeds about half of the reference group | It is not a target every child must reach | Continue plotting accurate measurements over time |
| 10th percentile | The measurement equals or exceeds about 10% of the reference group | It is not automatically too small or unhealthy | Compare with prior points, family pattern, and other measures |
| 90th percentile | The measurement equals or exceeds about 90% of the reference group | It is not automatically excessive or unhealthy | Interpret the trend and proportional measures |
| Stable path near one percentile channel | The child is following a relatively consistent rank | It does not guarantee that nutrition or health is optimal | Continue routine monitoring and clinical review |
| Single unexpected point | The value differs from nearby measurements | It does not prove a sudden biological change | Check age, units, chart choice, technique, and data entry; remeasure when appropriate |
| Repeated downward movement | The child is losing rank relative to the reference group | It does not identify the cause | Review intake, illness, symptoms, family history, and measurement quality with a clinician |
| Repeated upward movement | The child is gaining rank relative to the reference group | It does not by itself diagnose excess weight or endocrine disease | Review proportional measures, growth tempo, puberty, medicines, and health context |
| Different percentile after age 2 transition | The reference and measurement method changed | It does not necessarily represent true growth acceleration or slowing | Interpret the WHO-to-CDC switch cautiously and follow subsequent points |
| Z-score | The measurement’s distance from the reference median in standard deviations | It is not a separate physical measurement | Use professional software or validated chart tools for accurate calculation |
- • For example, the 10th percentile means the child equals or exceeds approximately 10% of the reference population for that measure, age, and sex.
- • A child can be healthy at many percentile levels when growth is proportionate and the longitudinal pattern is appropriate.
Download or export
Age-Specific Growth Chart Screening Cutoffs
These cutoffs identify measurements that need appropriate interpretation. They are screening categories, not stand-alone diagnoses or treatment instructions.
Swipe horizontally inside the table to view every column.
| Age and measure | Chart category | Percentile or threshold | Interpretation caution |
|---|---|---|---|
| Birth to younger than 2 years: weight-for-length | Low weight-for-length | Below the 2nd percentile | Confirm accurate weight and recumbent length, then assess the full growth pattern |
| Birth to younger than 2 years: weight-for-length | High weight-for-length | Above the 98th percentile | Use infant-specific assessment; do not substitute adult BMI categories |
| Birth to younger than 2 years: length-for-age | Short stature screening cutoff | Below the 2nd percentile | Family stature, gestational history, proportionality, and trend all matter |
| Age 2 to 20 years: BMI-for-age | Underweight | Below the 5th percentile | BMI is a screening measure and requires clinical context |
| Age 2 to 20 years: BMI-for-age | Healthy weight category | 5th percentile to below the 85th percentile | A category does not replace nutrition, activity, development, or medical assessment |
| Age 2 to 20 years: BMI-for-age | Overweight | 85th percentile to below the 95th percentile | Use respectful, family-centered assessment and confirm measurement accuracy |
| Age 2 to 20 years: BMI-for-age | Obesity | 95th percentile or higher | Evaluate health risks and growth trajectory with a qualified clinician |
| Age 2 to 20 years: BMI-for-age | Severe obesity | At least 120% of the 95th percentile or BMI at least 35 kg/m² | Use the CDC extended chart and individualized clinical care |
| Age 2 to 20 years: very high BMI | Extended-chart plotting range | Above the 97th percentile | The 2022 extended curves support tracking; they do not change the need for comprehensive care |
BMI is calculated as weight in kilograms divided by height in meters squared (kg/m²). Pediatric interpretation then uses age- and sex-specific percentiles.
- • WHO infant cutoffs use the outer 2nd and 98th percentile curves on the adapted charts.
- • Pediatric BMI categories apply only to children and adolescents age 2 to 20 years and differ from adult BMI categories.
- • A threshold should trigger appropriate review, not stigma, blame, or a conclusion based on one measurement.
Download or export
Measurement technique can change the plotted percentile
Shoes, carpet, bent knees, heavy clothing, an uncalibrated scale, mixed units, or incorrect age can create a false change. Review CDC height and weight measurement steps before interpreting a surprising value.
How to Measure for a Growth Chart
Accurate equipment, posture, clothing, age calculation, and units are essential. Small errors can move a plotted point, especially in infants.
Swipe horizontally inside the table to view every column.
| Task | Recommended method | Common error | Quality check |
|---|---|---|---|
| Record age | Use date of birth and exact measurement date; account for prematurity when instructed | Rounding age to a whole year or month too early | Verify both dates before plotting |
| Weigh an infant | Use a calibrated infant scale with minimal clothing and no diaper when clinically appropriate | Holding the infant on an adult scale or including heavy clothing | Repeat if the infant moves or the value is unexpected |
| Measure recumbent length | Use an infant length board with two trained measurers when possible; head against the fixed board and legs fully extended | Using a tape measure on a soft surface or leaving knees flexed | Repeat and compare measurements if they differ |
| Measure head circumference | Place a nonstretch tape around the widest occipital-frontal circumference | Tape angled, loose, compressed, or placed over bulky hair | Record the largest accurate repeat measurement |
| Measure standing height | Remove shoes and bulky hair items; use firm flooring and a flat vertical surface or stadiometer | Carpet, shoes, bent knees, raised heels, or looking up or down | Feet flat, legs straight, shoulders level, head facing forward |
| Weigh a child or adolescent | Use a calibrated digital scale on firm flooring with light clothing and no shoes | Scale on carpet, leaning, carrying objects, or inconsistent clothing | Center weight evenly and repeat an implausible value |
| Choose units | Use kilograms and centimeters when possible; convert once with a verified formula | Mixing pounds with kilograms or inches with centimeters | Confirm units before BMI calculation and data entry |
| Plot the point | Use the correct age, sex, chart, measure, and intersection of the axes | Plotting weight on a BMI chart or using the wrong sex-specific chart | Read the chart title and axes before marking |
- • Home measurements can help record a trend, but clinical decisions should use reliable equipment and standardized technique.
- • When a new point is surprising, check technique and data entry before assuming the child’s growth changed suddenly.
Download or export
Growth change and velocity calculator
Enter two measurements to summarize the interval, total change, and mathematical average rate. This tool deliberately does not assign a percentile or label the result as normal or abnormal.
Important: this tool does not calculate WHO or CDC percentiles, correct age for prematurity, assess puberty, or diagnose growth faltering. Do not delay care for poor feeding, dehydration, weight loss, breathing difficulty, persistent vomiting, or other concerning symptoms.
Growth Patterns That Need Context
Growth curves change for many reasons. The sequence of weight, length or height, BMI, head circumference, symptoms, and development helps determine what a pattern may mean.
Swipe horizontally inside the table to view every column.
| Pattern | Possible explanation | What to review | Appropriate response |
|---|---|---|---|
| Steady weight and height channels | Consistent individual growth pattern | Family stature, nutrition, development, puberty, and routine health | Continue scheduled measurements |
| Weight slows before length or height | Reduced intake, feeding difficulty, illness, malabsorption, higher energy needs, or measurement error may contribute | Feeding history, symptoms, medications, psychosocial factors, and technique | Arrange timely pediatric review when the pattern is repeated or symptoms are present |
| Height or length slows while weight is preserved | Measurement error, familial short stature, delayed puberty, endocrine, skeletal, or chronic conditions may contribute | Accurate serial height, growth velocity, family heights, puberty, and medical history | Discuss with a clinician; persistent linear-growth slowing deserves assessment |
| Weight or BMI rises faster than height | Growth tempo, puberty, reduced activity, medicines, nutrition, sleep, or health conditions may contribute | BMI-for-age trend, family history, blood pressure, sleep, activity, and medicines | Use family-centered clinical assessment rather than dieting from a chart alone |
| Head circumference changes rank rapidly | Technique, familial pattern, skull growth, fluid, or neurologic factors may contribute | Repeat measurement, development, head shape, neurologic symptoms, and family head size | Prompt pediatric assessment when confirmed or accompanied by symptoms |
| Abrupt point after illness or dehydration | Temporary fluid or intake change | Illness timeline, hydration, recovery, and repeat measurement | Recheck after recovery according to clinical advice |
| Percentile shift near puberty | Earlier or later pubertal timing changes growth tempo | Pubertal stage, family pattern, nutrition, chronic illness, and subsequent height velocity | Interpret across time rather than from one age point |
| Percentile change at age 2 | Switch from recumbent length and weight-for-length to standing height and BMI-for-age | Chart type, posture, exact age, and measurement technique | Use caution before labeling a new problem |
- • The same chart pattern can have different causes, and a chart cannot identify the diagnosis by itself.
- • Growth faltering is more likely when abnormal weight change is confirmed across reliable serial measurements and fits the clinical picture.
Download or export
Expect possible percentile movement when the chart changes at age 2
The transition changes the reference population, the cutoff system, recumbent length to standing height, and weight-for-length to BMI-for-age. CDC advises cautious interpretation during this switch.
Special Situations in Growth Monitoring
Some children need a different age adjustment, chart, measurement method, or interpretation plan. General online charts should not override specialty guidance.
Swipe horizontally inside the table to view every column.
| Situation | Growth-chart consideration | Why standard plotting may mislead | Practical approach |
|---|---|---|---|
| Prematurity | Use a preterm growth tool around term age and corrected-age guidance afterward | Chronological age alone makes early size appear lower than expected | Follow the neonatal or pediatric plan for chart transition and age correction |
| Age 2 transition | Switch from WHO infant standards to CDC child references | Standing height is shorter than recumbent length and BMI replaces weight-for-length | Expect possible classification changes and follow the new trend |
| Very high BMI | Use the 2022 CDC Extended BMI-for-Age Chart above the 97th percentile | The original chart has limited curves above the 95th percentile | Track with extended percentiles and comprehensive clinical care |
| Genetic, skeletal, or chronic condition | A condition-specific reference may supplement the standard chart | Body proportions or expected growth tempo may differ from the general population | Use the chart recommended by the child’s clinical team |
| Edema, dehydration, ascites, or large fluid shifts | Weight may change without tissue growth | Fluid status can move the plotted point quickly | Treat the underlying issue and interpret repeat weights clinically |
| Mobility or posture limitation | Alternative length, segmental, or specialty measurements may be needed | Standing height may be unreliable or impossible | Use trained measurement and consistent technique |
| Breastfed or formula-fed infant | Use WHO standards regardless of feeding type in U.S. clinical practice | Early weight patterns differ between feeding groups | Assess feeding effectiveness, hydration, and serial growth rather than changing charts |
| Early or late puberty | Interpret height velocity and BMI with pubertal timing | Same chronological age can represent different maturation stages | Review development and family pattern with a clinician |
- • The Fenton chart is a commonly referenced sex-specific tool for preterm weight, length, and head circumference by gestational age.
- • Corrected age is calculated from the number of weeks born before 40 weeks, but the duration of correction should follow the child’s care plan.
Download or export
Prematurity requires gestational and corrected-age context
Plotting only chronological age can make an early preterm infant appear smaller than expected. AAP lists preterm growth tools for weight, length, and head circumference; the child’s neonatal or pediatric team should direct the transition plan.
Growth and Feeding Warning Signs
The chart is only one part of assessment. Symptoms, hydration, feeding, development, and the child’s overall appearance can make care more urgent.
Swipe horizontally inside the table to view every column.
| Finding | Why it matters | Suggested urgency |
|---|---|---|
| Infant is difficult to wake, very weak, blue, struggling to breathe, or unresponsive | May signal a life-threatening illness rather than an isolated growth issue | Emergency care now |
| Infant has poor feeding with markedly fewer wet diapers, dry mouth, no tears, or a sunken soft spot | Possible dehydration or serious illness | Same-day urgent assessment; emergency care if severe |
| Persistent vomiting, green vomit, blood in vomit or stool, or severe abdominal swelling | Can indicate obstruction, bleeding, infection, or another urgent condition | Urgent or emergency assessment |
| Confirmed weight loss or poor weight gain in a young infant | Infants have limited reserves and may deteriorate quickly | Prompt pediatric assessment |
| Weight or weight-for-length repeatedly declines across major percentile channels | May reflect growth faltering, illness, feeding difficulty, or inadequate intake | Timely clinical evaluation |
| Length or height growth repeatedly slows or plateaus | Can reflect measurement error, constitutional pattern, endocrine, skeletal, or chronic disease | Arrange pediatric review |
| Head circumference trend changes rapidly or is paired with developmental regression, seizures, or persistent vomiting | May indicate a neurologic or intracranial problem | Urgent clinical assessment |
| Child has swelling, severe thirst and urination, chronic diarrhea, persistent fever, or ongoing pain with growth change | Systemic illness may be affecting growth | Prompt medical assessment |
| Caregiver is unsure how to prepare formula or feeding is painful, exhausting, or unsafe | Preparation errors and feeding dysfunction can reduce intake or create risk | Seek timely feeding and pediatric support |
| One surprising home measurement without symptoms | Technique, equipment, units, or data entry may be wrong | Repeat carefully and discuss if the result persists |
- • Call local emergency services for severe breathing difficulty, unresponsiveness, seizures, collapse, blue color, or other life-threatening symptoms.
- • Do not delay care because a previous percentile looked normal; current symptoms take priority.
Download or export
Confirmed poor weight gain in an infant needs prompt assessment
Repeated decline in weight or weight-for-length can reflect feeding difficulty, inadequate intake, higher energy needs, illness, malabsorption, psychosocial factors, or measurement error. AAP recommends evaluation of infants with concerning growth patterns.
Growth chart FAQs
What is a child growth chart?
A child growth chart is a set of age- and sex-specific percentile curves used to plot measurements such as weight, length or height, head circumference, weight-for-length, and BMI. It helps track a pattern over time but is not a diagnosis by itself.
Which growth chart should be used for a baby?
In U.S. clinical practice, CDC and AAP recommend WHO Child Growth Standards from birth to 2 years. These include weight-for-age, length-for-age, weight-for-length, and head circumference-for-age charts.
Which growth chart is used after age 2?
The 2000 CDC Growth Charts are recommended from age 2 to 20 years in U.S. clinical practice. They include stature-for-age, weight-for-age, and BMI-for-age charts. Very high BMI values may be plotted on the 2022 extended BMI charts.
What does the 50th percentile mean?
The 50th percentile means the measurement equals or exceeds about half of the chart’s reference population for the same age and sex. It is not an ideal score or a target every child should reach.
Is the 10th percentile too low?
Not necessarily. Some healthy children consistently track near the 10th percentile. Interpretation depends on accurate serial measurements, proportionality, family pattern, development, nutrition, symptoms, and medical history.
Is a higher growth percentile better?
No. A higher percentile is not automatically healthier. Growth charts rank body measurements; they do not grade health. A stable, proportionate pattern and the child’s overall health matter more than being near the top or middle.
Why did the percentile change at age 2?
At age 2, clinicians typically switch from WHO to CDC charts, from recumbent length to standing height, and from weight-for-length to BMI-for-age. Any of these changes can shift the percentile without a sudden biological change.
How often should a child be measured?
Measurements are usually taken at scheduled health visits and more often when a clinician is monitoring a concern. Measuring too frequently at home can magnify normal fluctuation and technique error.
Can I calculate a growth percentile from height and weight alone?
No. Accurate percentile calculation also requires exact age, sex, the correct chart, and the correct measurement type. Pediatric BMI percentiles additionally require a validated age- and sex-specific calculation.
What is growth velocity?
Growth velocity is the rate of change between reliable measurements, such as centimeters per year or kilograms per month. It must be interpreted for age, puberty, health context, and measurement interval rather than compared with one universal normal rate.
How are preterm infants plotted?
Preterm infants may be plotted on a preterm growth chart around term age and then monitored using corrected-age guidance. The exact chart and duration of age correction should follow the neonatal or pediatric care plan.
Can home measurements replace clinic measurements?
Home measurements can help document a trend, but equipment, posture, clothing, and technique can introduce error. Clinical decisions should rely on standardized measurements and professional interpretation.
When does a falling percentile need evaluation?
A single lower point may be measurement error or normal variation. Repeated downward movement, confirmed poor weight gain, slowing height, feeding problems, illness symptoms, or developmental concerns should be reviewed by a clinician.
Does a growth chart predict adult height?
A growth chart can show current height rank and growth pattern, but it cannot predict adult height with certainty. Genetics, puberty timing, nutrition, chronic illness, hormones, and other factors influence final stature.
Does this growth change calculator diagnose a problem?
No. The calculator only summarizes the time interval, measurement change, and average rate between two entries. It does not calculate a percentile, determine what is normal, or diagnose growth faltering.
Sources
URLs are shown as plain text for transparent reference. Table-specific source names link to this section.
Centers for Disease Control and Prevention — What Growth Charts Are Recommended?
Recommends WHO standards from birth to 2 years, CDC charts from age 2 to 20 years, and extended BMI charts for very high BMI values.
https://www.cdc.gov/growth-chart-training/hcp/overview/recommended.html
Centers for Disease Control and Prevention — WHO Child Growth Standards
Explains infant measures, percentile cutoffs, serial monitoring, and the transition from WHO standards to CDC references at age 2 years.
https://www.cdc.gov/growth-chart-training/hcp/training/who-child-growth-standards-training.html
Centers for Disease Control and Prevention — Measuring Children’s Height and Weight
Provides practical steps for measuring standing height and weight accurately before calculating BMI or plotting a growth chart.
https://www.cdc.gov/bmi/child-teen-calculator/measure-child-height-weight.html
Centers for Disease Control and Prevention — Background: CDC Extended BMI-for-Age Growth Charts
Defines pediatric BMI categories and explains use of the 2022 extended BMI charts for children and adolescents with very high BMI values.
https://www.cdc.gov/growth-chart-training/hcp/extended-growth-charts/index.html
American Academy of Pediatrics — Growth Faltering in Newborns and Infants
Describes concerning weight patterns, the importance of serial measurements, and clinical evaluation of infants with poor weight gain.
https://www.aap.org/en/patient-care/newborn-infant-and-early-childhood-nutrition/growth-faltering-in-newborns-and-infants/
American Academy of Pediatrics — Preterm Infant Growth Tools
Summarizes Fenton and other preterm growth tools for weight, length, and head circumference by gestational age.
https://www.aap.org/en/patient-care/newborn-infant-and-early-childhood-nutrition/newborn-and-infant-nutrition-assessment-tools/preterm-infant-growth-tools/