Health & Medical · Hearing and audiogram reference
Hearing Frequency Chart: Human Range, Speech and Audiograms
Compare low, middle, high, and extended-high frequencies; understand common audiogram test points and speech cues; distinguish pitch from loudness; and recognize hearing changes that need professional or urgent assessment.
This chart cannot test or diagnose hearing. Consumer speakers, headphones, device volume, room noise, and online tones are not clinically calibrated. Do not increase volume to chase a frequency you cannot hear. Sudden hearing loss needs same-day medical assessment. Read the ChartsLoom Disclaimer.
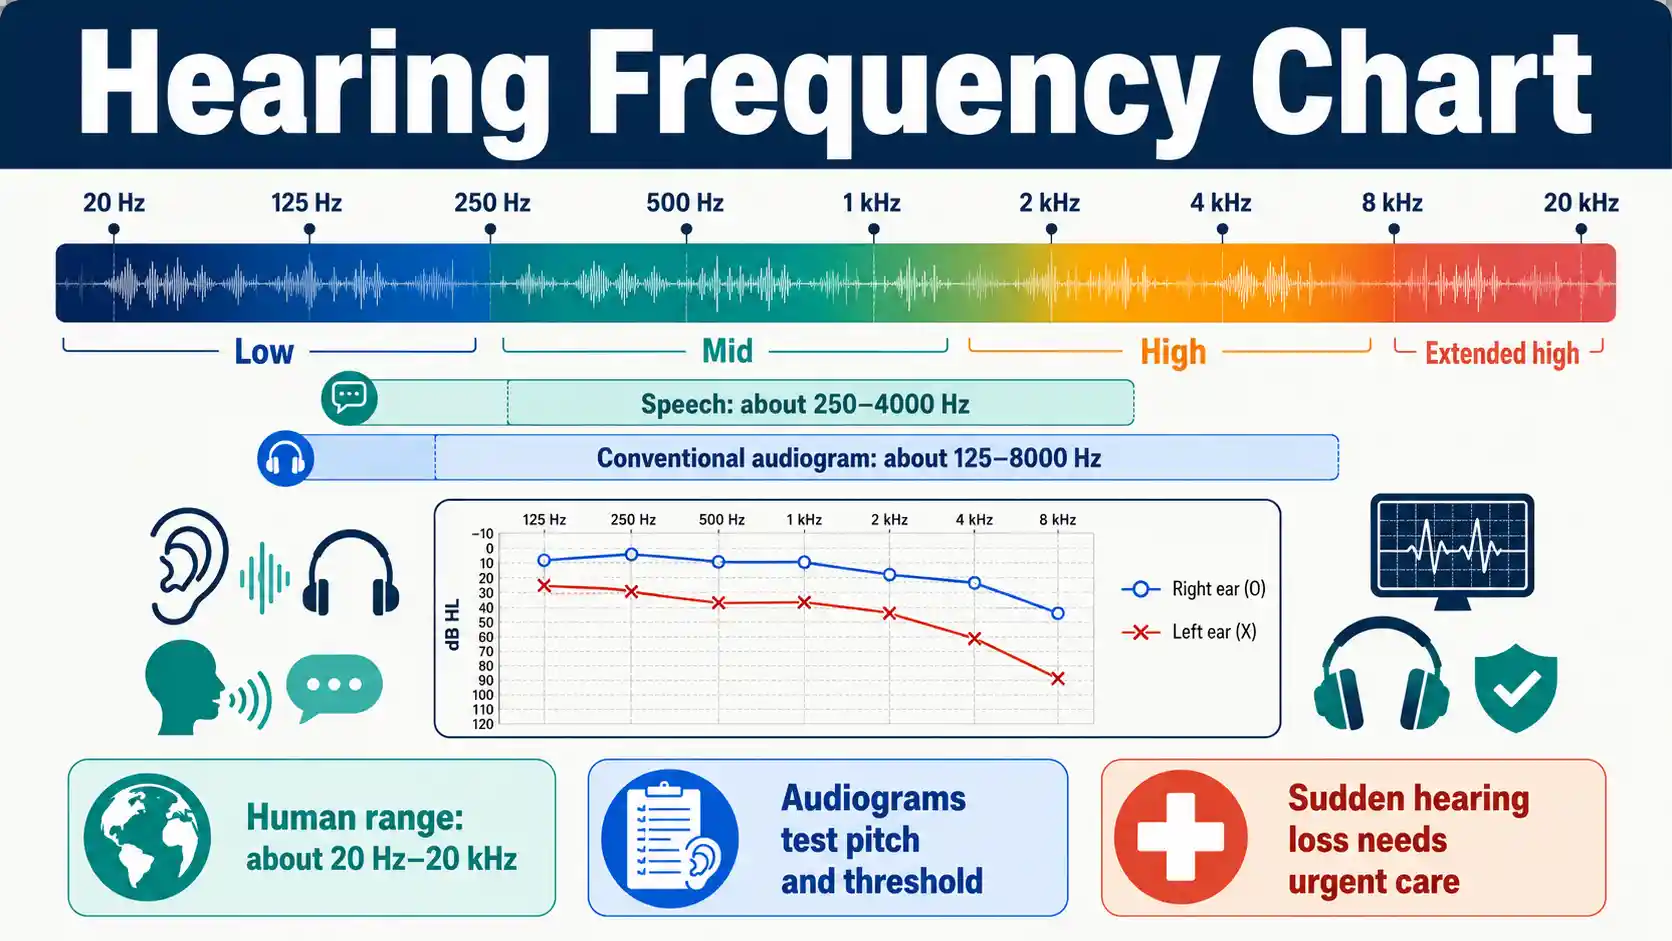
What frequencies can humans hear?
A healthy young auditory system may detect tones from approximately 20 Hz to 20,000 Hz in quiet. Routine audiograms usually concentrate on 250 through 8000 Hz because this range contains major speech and communication information.
NCBI describes the approximate human audible spectrum, while emphasizing that upper-frequency sensitivity commonly declines as people mature and age.
Young-human range
About 20 Hz–20 kHz
The highest detectable frequency often falls with age and varies between individuals.
Routine audiogram
Usually 250–8000 Hz
A 125 Hz point may be added when low-frequency hearing loss is suspected.
Broad speech region
About 250–4000 Hz
Speech extends beyond this range, but it captures many key communication cues.
Urgent symptom
Sudden hearing loss
A rapid change over hours or days requires same-day medical assessment.
Human Hearing Frequency Bands Chart
These practical bands organize the approximate human sound spectrum. Their boundaries are educational rather than universal clinical cutoffs.
Swipe horizontally inside the table to view every column.
| Frequency range | Educational band | Typical pitch context | Hearing and testing context |
|---|---|---|---|
| Below 20 Hz | Infrasound | Very slow pressure changes or vibration | Usually below conscious pitch perception; intense vibration may be felt |
| 20–249 Hz | Low audible frequencies | Deep rumble, bass, low-pitched voice energy | Includes the lowest audible range and the low end of diagnostic audiometry |
| 250–1999 Hz | Mid audible frequencies | Much vowel energy and core speech audibility | Central to speech detection, hearing screening, and pure-tone averages |
| 2000–8000 Hz | High audible frequencies | Consonant detail, clarity, birds, alarms, and high musical overtones | Conventional audiometry evaluates this region; high-frequency loss often reduces speech clarity |
| Above 8000 to about 20,000 Hz | Extended high frequencies | Very high pitch and fine overtones | Outside most routine audiograms; upper sensitivity varies greatly with age, exposure, and equipment |
| Above about 20,000 Hz | Ultrasound | Above the commonly cited human audible range | Not evaluated by ordinary hearing tests or consumer online tests |
Hz = cycles per second; 1000 Hz = 1 kHz.
- • A healthy young auditory system may detect approximately 20 Hz to 20 kHz in quiet, but the upper limit often decreases with age and other factors.
- • Audibility depends on sound level as well as frequency. A frequency can exist without being loud enough to hear.
- • The low, mid, high, and extended-high groupings are useful teaching bands, not diagnoses or standardized severity categories.
Download or export
Frequency spectrum
Human hearing covers a wider range than a routine audiogram
A healthy young auditory system may detect roughly 20 Hz to 20 kHz in quiet. Conventional clinical audiometry concentrates on about 125 or 250 Hz through 8 kHz because that region carries major speech and everyday communication cues.
Common Audiogram Test Frequencies
A diagnostic audiogram plots the softest sound heard at selected frequencies for each ear. Test sets vary by purpose, age, symptoms, and clinical protocol.
Swipe horizontally inside the table to view every column.
| Frequency | Pitch region | Why it may be tested | Interpretation caution |
|---|---|---|---|
| 125 Hz | Very low | Added when low-frequency hearing loss is suspected or a fuller diagnostic picture is needed | Not included in every routine protocol |
| 250 Hz | Low | Lowest common conventional diagnostic point and part of low-frequency configuration | Room noise and headphone fit can influence low-frequency thresholds |
| 500 Hz | Low to mid | Major speech audibility region and common pure-tone-average component | A threshold must be interpreted with adjacent frequencies and the other ear |
| 1000 Hz | Mid | Core speech frequency, common screening point, and frequent starting or reliability-check tone | One frequency cannot summarize overall hearing |
| 2000 Hz | Mid to high | Important speech information and common pure-tone-average component | Speech understanding also depends on higher-frequency cues and cognition |
| 3000 Hz | High | Bridges 2 and 4 kHz; required in many occupational programs | Can help reveal sloping or notched patterns |
| 4000 Hz | High | Consonant clarity and a region commonly affected by noise-related damage | A 4 kHz dip is not proof that noise is the only cause |
| 6000 Hz | High | Occupational monitoring and high-frequency configuration | Test–retest variability can be greater at high frequencies |
| 8000 Hz | Highest conventional point | Defines the upper end of many diagnostic audiograms | Hearing above 8 kHz is usually called extended-high-frequency hearing |
- • ASHA describes conventional pure-tone testing as typically covering 250 through 8000 Hz, with 125 Hz added when low-frequency loss is suspected.
- • OSHA workplace audiograms must include at least 500, 1000, 2000, 3000, 4000, and 6000 Hz for each ear; clinical and research protocols may include more frequencies.
- • The clinician may test half-octave frequencies such as 750 or 1500 Hz when adjacent thresholds differ substantially.
Download or export
Frequency is pitch; dB HL is the hearing threshold level
On an audiogram, low-to-high frequency runs from left to right. Soft-to-loud threshold level runs from top to bottom. ASHA explains that the audiogram shows how loud each frequency must be before it is heard.
Speech Frequency and Clarity Chart
Speech spans many frequencies and levels. Vowels carry much of the loudness, while higher-frequency consonants contribute heavily to word distinction and clarity.
Swipe horizontally inside the table to view every column.
| Approximate region | Speech contribution | What difficulty may sound like | Important context |
|---|---|---|---|
| About 250–500 Hz | Low-frequency vowel energy and voice fullness | Voices may sound thin or weak when low-frequency audibility is reduced | Background noise and room acoustics can mask low-frequency cues |
| About 500–1000 Hz | Strong vowel and syllable energy | Speech may seem quieter or less full | This region is commonly included in speech-frequency averages |
| About 1000–2000 Hz | Word structure, many voiced consonants, and central speech information | Speech may be audible but less distinct | Listening effort can rise before a person notices obvious hearing loss |
| About 2000–4000 Hz | Many consonant distinctions and crispness | Words may sound muffled; similar words become easier to confuse | High-frequency loss often affects clarity more than perceived volume |
| Above 4000 Hz | Very high consonant energy, frication, and fine speech detail | Soft plural, ending, or high-pitched cues may be missed | Routine speech testing and hearing-aid fitting use more than frequency alone |
| Speech banana overall | A broad cluster around 250–4000 Hz and roughly 20–60 dB on a typical audiogram | A person can hear some speech sounds but miss others | The speech banana is an educational overlay, not an individual speech test |
- • ASHA places the typical speech banana at approximately 250–4000 Hz and 20–60 dB on an audiogram.
- • Speech understanding also depends on language, attention, cognition, visual cues, reverberation, signal-to-noise ratio, and whether both ears work together.
- • Phoneme locations on speech-banana graphics are approximate and vary with speaker, level, accent, and measurement method.
Download or export
How to Read an Audiogram
An audiogram combines frequency and threshold level. Read each ear separately, then review the pattern, symmetry, speech results, and air–bone relationship with an audiologist.
Swipe horizontally inside the table to view every column.
| Audiogram element | What it represents | How to read it | Common mistake |
|---|---|---|---|
| Horizontal axis | Frequency in hertz | Low pitch is on the left and high pitch is on the right | Calling the horizontal axis volume |
| Vertical axis | Threshold in dB HL | Softer levels are near the top; larger dB HL values appear lower | Assuming a lower plotted mark means better hearing |
| Threshold symbol | Softest level detected about half the time at that frequency | Follow symbols across frequencies to see the configuration | Treating one point as a complete hearing result |
| Right and left ear traces | Ear-specific air-conduction thresholds | Compare ears for symmetry and frequency-specific differences | Averaging both ears before noticing a unilateral problem |
| Bone-conduction thresholds | Inner-ear sensitivity reached through skull vibration | Compare with air conduction to help identify an air–bone gap | Using an online chart to diagnose conductive or sensorineural loss |
| Speech testing | Speech awareness, recognition, or understanding under defined conditions | Compare speech results with pure-tone thresholds and everyday complaints | Assuming pure tones fully predict speech-in-noise ability |
| Configuration | Shape across frequencies: flat, sloping, rising, notched, or other pattern | Describe the shape before considering possible causes | Assigning a cause from shape alone |
| Degree or severity label | Clinic-specific summary of threshold levels | Check the exact scale, frequencies, and ear used for the label | Assuming every organization uses identical category boundaries |
- • dB HL is a calibrated hearing-level scale, not the same measurement as environmental dB SPL or dBA.
- • A complete evaluation may include otoscopy, tympanometry, acoustic reflexes, otoacoustic emissions, speech testing, and other tests in addition to pure tones.
- • Professional classification systems and cutoff values differ; use the report provided by the testing clinic.
Download or export
Hearing frequency explorer
Enter a frequency to identify its educational band, nearest conventional audiogram point, approximate wavelength, and whether it falls inside the broad speech-frequency region. The tool does not play sound or test hearing.
1 kHz
Mid audible frequency
Contains substantial vowel energy and many cues that support speech audibility.
- Nearest audiogram point
- 1 kHz
- Standard test point
- Yes
- Speech region
- Within 250–4000 Hz
- Wavelength in air
- About 34.3 cm
Limitation: Speech understanding still depends on higher-frequency consonant information. This calculation cannot determine whether you can hear the frequency or whether a sound is safe.
Hearing Loss Patterns by Frequency
The shape of an audiogram describes where thresholds are poorer. It can guide evaluation but cannot identify the cause without history, examination, and additional testing.
Swipe horizontally inside the table to view every column.
| Pattern | Audiogram appearance | Possible listening effect | Clinical interpretation |
|---|---|---|---|
| High-frequency sloping | Thresholds worsen toward 2000–8000 Hz | Consonants and speech clarity may be reduced, especially in noise | Common with aging, noise exposure, and several other conditions |
| Low-frequency rising | Thresholds are poorer at low frequencies and improve toward higher frequencies | Deep voices or low-frequency environmental cues may be reduced | May occur with conductive or inner-ear conditions; evaluation is required |
| Flat | Similar threshold level across much of the frequency range | Speech may sound uniformly softer | Can have conductive, sensorineural, or mixed causes |
| Notched | Localized dip with better thresholds on one or both sides | Difficulty may be subtle outside noisy settings | A 3000–6000 Hz notch, often near 4000 Hz, may be noise-associated but is not diagnostic alone |
| Mid-frequency or cookie-bite | Thresholds are poorer in the middle than at low and high frequencies | Conversation may be affected despite better low and high endpoints | Can be associated with genetic and other causes |
| Asymmetric | One ear is poorer than the other at one or more frequencies | Sound localization and speech-in-noise understanding may suffer | Clinically significant asymmetry may need medical or audiologic follow-up |
| Air–bone gap | Air thresholds are poorer than bone thresholds at related frequencies | Sound may be reduced by outer- or middle-ear transmission | Supports a conductive component when testing and masking are valid |
| No response at equipment limit | No threshold is obtained at the maximum test output | The actual threshold may be poorer than the plotted limit | Must be documented as no response rather than treated as an exact threshold |
- • Configuration is descriptive. Earwax, middle-ear fluid, noise exposure, medicines, genetics, infections, aging, and neurologic conditions can produce overlapping patterns.
- • Sudden or rapidly changing asymmetry is more urgent than a stable long-standing pattern.
- • Bone-conduction and masking procedures require calibrated equipment and trained interpretation.
Download or export
Audiogram shape describes the pattern, not the cause
A high-frequency slope, low-frequency rise, flat loss, notch, or air–bone gap narrows the clinical questions but does not make a diagnosis. Ear examination, history, speech testing, middle-ear measures, bone conduction, and sometimes medical evaluation are needed.
Hearing Tests by Age, Purpose and Frequency Detail
Different tests answer different questions. Some measure a behavioral response to frequency and level; others measure ear or auditory-pathway function without requiring a spoken response.
Swipe horizontally inside the table to view every column.
| Test or setting | Typical use | What it measures | Frequency detail and limitation |
|---|---|---|---|
| Newborn OAE screening | Hospital or early newborn screening | Echoes produced by functioning outer hair cells | Uses probe stimuli rather than a complete behavioral audiogram; a pass does not rule out every hearing disorder |
| Automated ABR screening | Newborn screening and selected high-risk infants | Auditory pathway response to sound | Screening result is pass or refer; diagnostic ABR is more detailed |
| Diagnostic ABR | Infants or people unable to provide reliable behavioral responses | Estimated auditory thresholds and neural timing | Frequency-specific tone bursts may be used, but estimates are not identical to adult behavioral thresholds |
| Visual reinforcement audiometry | Developmentally appropriate infants and toddlers | Conditioned head-turn response to sound | Sound-field results may reflect the better ear unless ear-specific transducers are used |
| Conditioned play audiometry | Young children able to perform a listening game | Behavioral thresholds through play responses | Reliability depends on development, conditioning, attention, and ear-specific setup |
| Conventional pure-tone audiometry | Older children and adults | Softest tones heard across selected frequencies | Typically covers 250–8000 Hz, with 125 Hz added when indicated |
| Adult pure-tone screening | Brief pass-or-refer check | Responses at selected frequencies and a set screening level | One ASHA example uses 25 dB HL at 1000, 2000, and 4000 Hz; local protocols vary |
| Occupational audiometry | Baseline and annual workplace hearing conservation | Air-conduction thresholds at required frequencies for each ear | OSHA minimum frequencies are 500 through 6000 Hz at specified points; this is not a full diagnostic evaluation |
| Extended-high-frequency audiometry | Specialty, research, ototoxicity, or early-change monitoring | Thresholds above 8000 Hz | Equipment, calibration, age, and transducer placement strongly affect results |
- • CDC recommends newborn hearing screening by 1 month of age, diagnostic evaluation by 3 months after a non-pass result, and intervention by 6 months after diagnosis.
- • A screening identifies who needs more testing; it does not determine the type, degree, or cause of hearing loss.
- • Ear-specific results require appropriate earphones or insert transducers. Sound-field testing alone cannot assign a threshold to each ear.
Download or export
A newborn screening result is not a complete audiogram
CDC describes OAE, ABR, and behavioral hearing tests. A baby who does not pass screening needs prompt diagnostic follow-up, even when the baby reacts to some sounds at home.
Frequency, Loudness and Safe Listening
Frequency determines pitch, while level and duration determine much of the risk from loud sound. A pleasant or high-quality sound can still be hazardous if exposure is intense enough.
Swipe horizontally inside the table to view every column.
| Concept or exposure | What frequency tells you | What level and duration tell you | Safer action |
|---|---|---|---|
| Quiet tone at any frequency | Pitch only | May be below hearing threshold and pose little risk | Do not raise volume aggressively to chase a tone you cannot hear |
| 80 dB weekly exposure example | Can contain low, mid, and high frequencies | WHO gives about 40 hours per week as a safe-listening example | Track cumulative listening time and take quiet breaks |
| 90 dB weekly exposure example | Frequency mix varies by source | WHO example falls to about 4 hours per week | Reduce level, shorten exposure, and increase distance |
| Very loud impulse or blast | Often broadband with substantial high-frequency energy | Can injure hearing immediately | Move away, use appropriate protection, and seek care for symptoms |
| Headphones or earbuds | Device response may not reproduce every frequency equally | Volume setting does not reliably equal ear-level dB | Use device exposure features when available and keep volume comfortably low |
| Concert, club, machinery, or power tools | Spectrum depends on source and location | Risk rises with louder and longer exposure | Use well-fitted hearing protection and take breaks in quieter areas |
| Noise-related audiogram notch | Often appears between 3000 and 6000 Hz, commonly near 4000 Hz | Reflects a threshold pattern, not the exposure dose itself | Review exposure history and repeat calibrated testing professionally |
| Ringing or muffled hearing after noise | May involve high-frequency injury even when speech remains audible | Temporary symptoms can precede permanent loss | Stop exposure and arrange assessment if symptoms persist or are severe |
- • WHO listening-time examples are public-health guidance, not workplace compliance limits and not guarantees for every individual.
- • NIDCD emphasizes that the louder the noise, the faster permanent damage can occur.
- • Frequency weighting such as dBA estimates human sensitivity across frequencies; it is not the same as an audiogram threshold in dB HL.
Download or export
Safe listening depends on level and time, not pitch alone
WHO gives public-health examples of about 40 hours per week at 80 dB and 4 hours per week at 90 dB. These are exposure examples, not guarantees or substitutes for workplace rules.
Hearing Warning Signs and Next Steps
Symptoms and timing can be more important than the frequency range involved. Sudden change, neurologic symptoms, trauma, or severe infection signs require prompt care.
Swipe horizontally inside the table to view every column.
| Finding | Why it matters | Suggested next step |
|---|---|---|
| Sudden hearing loss in one or both ears over hours to a few days | Sudden sensorineural hearing loss is a medical emergency and early treatment may affect outcome | Seek same-day urgent medical or ear-specialist assessment |
| Sudden hearing change with facial weakness, severe vertigo, trouble walking, severe headache, or other neurologic symptoms | May signal a neurologic emergency | Call emergency services now |
| Hearing loss after an explosion, firearm discharge, or head injury | Acoustic or physical trauma can damage the ear and other structures | Urgent medical assessment |
| Severe ear pain, fever, swelling behind the ear, bloody discharge, or pus | May indicate infection, eardrum injury, or another condition needing treatment | Prompt medical assessment; emergency care if severely ill |
| New one-sided tinnitus or asymmetric hearing | May require ear-specific testing and medical review | Arrange audiology or ear-specialist evaluation |
| Persistent ringing or muffled hearing after loud noise | Can be a sign of temporary or permanent noise injury | Avoid further noise and seek evaluation if it persists, worsens, or is severe |
| Child does not startle, respond to voices, develop speech as expected, or seems to hear only some sounds | Hearing differences can affect speech, language, learning, and safety | Request pediatric hearing screening or diagnostic testing promptly |
| Baby does not pass newborn hearing screening | A non-pass result needs timely diagnostic follow-up even if the baby reacts to some sounds | Arrange diagnostic testing as soon as possible and by 3 months in the U.S. benchmark |
| Gradual trouble hearing speech, especially in noise | Common presentation of hearing loss that may be missed by self-testing | Book a comprehensive hearing evaluation |
| Ear feels blocked with reduced hearing | Wax, fluid, infection, sudden inner-ear loss, or other causes may feel similar | Do not insert objects; seek assessment if persistent or sudden |
- • Do not delay urgent evaluation while repeating online tone tests or waiting for the ear to clear.
- • A person with sudden hearing loss may still hear some frequencies; partial loss can still be urgent.
- • Local emergency and referral pathways differ. Severe or rapidly progressive symptoms take priority over chart interpretation.
Download or export
Sudden hearing loss is a medical emergency
Do not assume a suddenly blocked or muffled ear is only wax, congestion, or a headphone problem. NIDCD advises treating sudden sensorineural hearing loss as an emergency because timely assessment and treatment can matter.
Hearing frequency chart FAQs
What frequency range can humans hear?
A healthy young auditory system can detect roughly 20 Hz to 20,000 Hz in quiet. The exact lower and upper limits vary with age, ear health, noise exposure, sound level, test method, and equipment, and many adults cannot hear near 20 kHz.
What does Hz mean in hearing?
Hertz, abbreviated Hz, means cycles per second. A 250 Hz tone vibrates 250 times per second and sounds lower in pitch than a 4000 Hz tone, which vibrates 4000 times per second.
What frequencies are tested on an audiogram?
Conventional diagnostic pure-tone audiometry typically tests frequencies from 250 through 8000 Hz, and 125 Hz may be added when low-frequency hearing loss is suspected. The exact set depends on age, symptoms, protocol, and purpose.
Why does an audiogram stop at 8000 Hz?
Most routine audiograms focus on frequencies that are important for speech and everyday communication and that can be measured reliably with conventional calibrated equipment. Testing above 8000 Hz is available in specialty and research settings.
What is the speech frequency range?
The commonly illustrated speech banana spans approximately 250 to 4000 Hz and about 20 to 60 dB on an audiogram. Real speech extends beyond these boundaries, and phoneme locations vary by speaker, level, language, and recording method.
Which frequencies are most important for speech clarity?
Speech uses a broad frequency range. Lower frequencies carry much of the vowel energy and loudness, while frequencies around 2000 to 4000 Hz and above carry many consonant cues that help distinguish similar words.
Is frequency the same as volume?
No. Frequency in hertz describes pitch. Sound level in decibels describes level or intensity. On an audiogram, dB HL records the calibrated threshold level needed to hear each frequency.
What does 0 dB HL mean?
Zero dB HL is an audiometric reference level based on average normal thresholds for the test frequency and transducer. It does not mean the absence of sound, and some people can hear slightly below 0 dB HL.
Why are high frequencies often lost first?
Aging, noise exposure, certain medicines, and several ear disorders can affect high-frequency cochlear regions early. However, hearing-loss shape alone cannot identify the cause, and some conditions primarily affect low or middle frequencies.
What is a 4000 Hz noise notch?
A noise-associated audiogram may show a dip between 3000 and 6000 Hz, commonly near 4000 Hz, with better thresholds at nearby frequencies. A notch can support an exposure history but does not prove that noise is the only cause.
Can an online frequency test diagnose hearing loss?
No. Consumer speakers, headphones, device volume, room noise, and browser software are not calibrated like clinical equipment. Online tones may demonstrate pitch but cannot replace ear-specific audiometry, speech testing, and professional interpretation.
Can I test 16 kHz hearing with headphones?
You may hear or fail to hear a 16 kHz file, but the result is not clinically reliable because many devices do not reproduce that frequency accurately and volume is unknown. High-frequency self-testing can also encourage unsafe volume increases.
What is the difference between dB HL and dBA?
dB HL is the calibrated scale used for hearing thresholds at specific test frequencies. dBA is an A-weighted environmental or occupational sound-level measure that reduces the contribution of frequencies to approximate human sensitivity.
When should sudden hearing loss be treated as urgent?
A sudden decrease in hearing over hours to a few days should be treated as a medical emergency, especially when one ear is affected or tinnitus, dizziness, or neurologic symptoms are present. Seek same-day medical assessment rather than waiting for an online test.
When should a baby have hearing screening?
The U.S. EHDI benchmark is hearing screening by 1 month of age, diagnostic evaluation by 3 months after a non-pass result, and early intervention by 6 months after confirmed hearing loss.
Sources
URLs are shown as plain text for transparent reference. Table-specific source names link to this section.
National Center for Biotechnology Information — The Audible Spectrum
Describes the approximate 20 Hz to 20 kHz frequency range detectable by humans and the reduction in upper-frequency sensitivity with maturation and aging.
https://www.ncbi.nlm.nih.gov/books/NBK10924/
American Speech-Language-Hearing Association — Audiograms and Hearing Loss Configuration
Explains audiogram frequency and decibel axes, the usual 125 Hz to 8000 Hz test range, the speech banana, and common hearing-loss configurations.
https://www.asha.org/public/hearing/audiogram/
American Speech-Language-Hearing Association — Hearing Loss in Adults
Summarizes pure-tone audiometry, air- and bone-conduction testing, threshold measurement, and typical conventional frequency coverage.
https://www.asha.org/practice-portal/clinical-topics/hearing-loss/
American Speech-Language-Hearing Association — Adult Hearing Screening
Provides an example adult pure-tone screening protocol using 25 dB HL at 1000, 2000, and 4000 Hz in both ears.
https://www.asha.org/practice-portal/professional-issues/adult-hearing-screening/
Centers for Disease Control and Prevention — Screening for Hearing Loss
Explains newborn screening, behavioral audiometry, auditory brainstem response, otoacoustic emissions, and other childhood hearing tests.
https://www.cdc.gov/hearing-loss-children/screening/index.html
Centers for Disease Control and Prevention — EHDI 1-3-6 Benchmarks
States the U.S. early-hearing benchmarks of screening by 1 month, diagnostic evaluation by 3 months after a non-pass result, and intervention by 6 months after diagnosis.
https://www.cdc.gov/hearing-loss-children/articles/baby-hearing-screening-infographic.html
World Health Organization — Deafness and Hearing Loss: Safe Listening
Explains that hearing risk depends on sound level and duration and gives weekly listening-time examples for 80 dB and 90 dB.
https://www.who.int/news-room/questions-and-answers/item/deafness-and-hearing-loss-safe-listening
National Institute on Deafness and Other Communication Disorders — How Does Noise Damage Your Hearing?
Explains permanent noise-induced hearing loss, the relationship between loudness and exposure time, and practical hearing-protection principles.
https://www.nidcd.nih.gov/health/how-does-noise-damage-your-hearing
National Institute on Deafness and Other Communication Disorders — Sudden Sensorineural Hearing Loss
Describes sudden sensorineural hearing loss as a medical emergency and explains the role of prompt pure-tone audiometry and treatment evaluation.
https://www.nidcd.nih.gov/health/sudden-deafness
Occupational Safety and Health Administration — Occupational Noise Exposure Standard
Specifies minimum occupational audiometric test frequencies and requirements for baseline and annual hearing-conservation audiograms.
https://www.osha.gov/laws-regs/regulations/standardnumber/1910/1910.95
Occupational Safety and Health Administration — OSHA Technical Manual: Noise
Explains that a noise-related audiogram may show a notch between 3000 and 6000 Hz, commonly around 4000 Hz, while emphasizing professional interpretation.
https://www.osha.gov/otm/section-3-health-hazards/chapter-5