Health & Medical · Body measurement reference
Height and Weight Chart: Adult BMI Ranges, Child Growth and Measurement
Compare adult BMI-based weight ranges by height, choose the correct child growth chart, measure accurately, convert units, understand limitations, and recognize changes that need medical review.
A height-and-weight chart is a screening reference, not a diagnosis or ideal-weight prescription. Adult BMI cutoffs do not apply to children, and pregnancy, muscle mass, edema, frailty, amputation, illness, and medications can change interpretation. Seek urgent care for rapid weight gain with severe breathlessness or chest symptoms, pregnancy warning signs, or other instability. Read the ChartsLoom Disclaimer.
How should height and weight be interpreted?
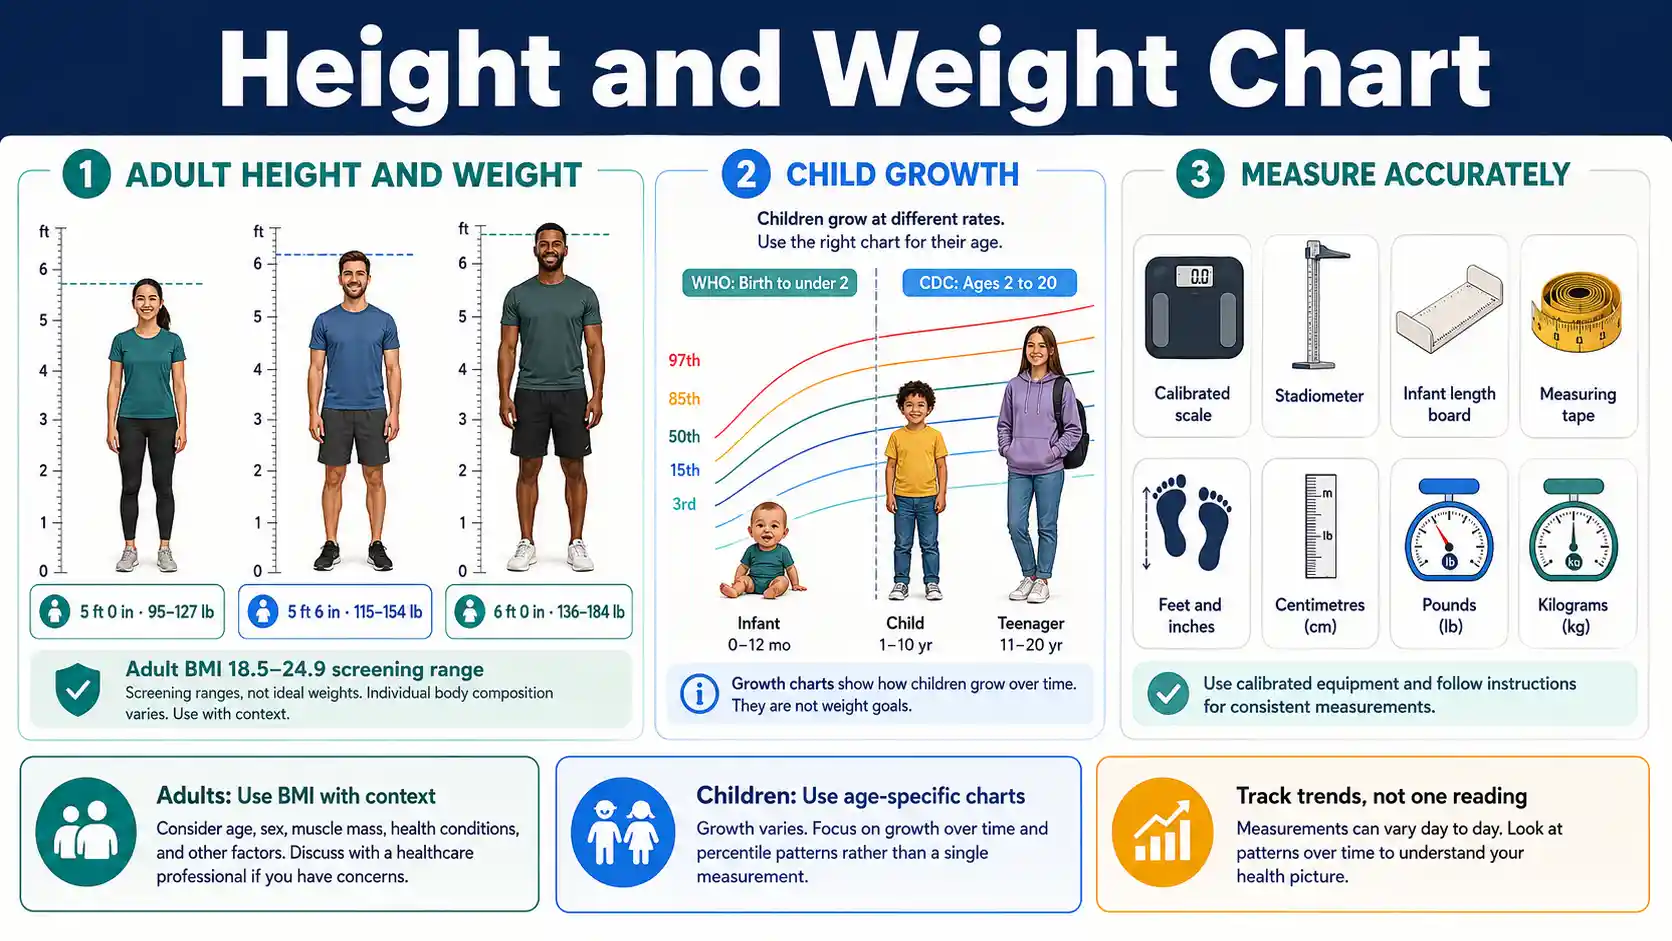
For adults age 20 and older, height and weight are often combined as BMI. The standard healthy-weight screening category is BMI 18.5 to less than 25, but it is a range rather than one ideal weight and it cannot describe body composition or overall health.
CDC defines adult BMI categories for people age 20 and older. Children require growth charts and BMI-for-age percentiles because expected height and weight change with age and sex.
Adult screening band
BMI 18.5–24.9
A calculated range, not a single ideal weight or diagnosis.
Birth to under 2
WHO standards
Use weight, recumbent length, weight-for-length, and head circumference.
Ages 2–20
CDC growth charts
Use stature, weight, and BMI-for-age percentiles in the U.S.
Interpretation rule
Trend plus context
Measurement technique, symptoms, age, and body composition matter.
Adult Height and Weight Chart by BMI
These calculated adult ranges show the body weights that correspond to BMI 18.5–24.9 at each height. They are screening ranges, not ideal weights or treatment targets.
Swipe horizontally inside the table to view every column.
| Height | Metric height | BMI 18.5–24.9 in pounds | BMI 18.5–24.9 in kilograms | BMI 25 begins near | BMI 30 begins near |
|---|---|---|---|---|---|
| 4 ft 10 in | 147 cm | 89–119 lb | 40–54 kg | 120 lb / 54 kg | 144 lb / 65 kg |
| 4 ft 11 in | 150 cm | 92–123 lb | 42–56 kg | 124 lb / 56 kg | 149 lb / 67 kg |
| 5 ft 0 in | 152 cm | 95–127 lb | 43–58 kg | 128 lb / 58 kg | 154 lb / 70 kg |
| 5 ft 1 in | 155 cm | 98–132 lb | 44–60 kg | 132 lb / 60 kg | 159 lb / 72 kg |
| 5 ft 2 in | 157 cm | 101–136 lb | 46–62 kg | 137 lb / 62 kg | 164 lb / 74 kg |
| 5 ft 3 in | 160 cm | 104–141 lb | 47–64 kg | 141 lb / 64 kg | 169 lb / 77 kg |
| 5 ft 4 in | 163 cm | 108–145 lb | 49–66 kg | 146 lb / 66 kg | 175 lb / 79 kg |
| 5 ft 5 in | 165 cm | 111–150 lb | 50–68 kg | 150 lb / 68 kg | 180 lb / 82 kg |
| 5 ft 6 in | 168 cm | 115–154 lb | 52–70 kg | 155 lb / 70 kg | 186 lb / 84 kg |
| 5 ft 7 in | 170 cm | 118–159 lb | 54–72 kg | 160 lb / 72 kg | 192 lb / 87 kg |
| 5 ft 8 in | 173 cm | 122–164 lb | 55–74 kg | 164 lb / 75 kg | 197 lb / 89 kg |
| 5 ft 9 in | 175 cm | 125–169 lb | 57–76 kg | 169 lb / 77 kg | 203 lb / 92 kg |
| 5 ft 10 in | 178 cm | 129–174 lb | 58–79 kg | 174 lb / 79 kg | 209 lb / 95 kg |
| 5 ft 11 in | 180 cm | 133–179 lb | 60–81 kg | 179 lb / 81 kg | 215 lb / 98 kg |
| 6 ft 0 in | 183 cm | 136–184 lb | 62–83 kg | 184 lb / 84 kg | 221 lb / 100 kg |
| 6 ft 1 in | 185 cm | 140–189 lb | 64–86 kg | 189 lb / 86 kg | 227 lb / 103 kg |
| 6 ft 2 in | 188 cm | 144–194 lb | 65–88 kg | 195 lb / 88 kg | 234 lb / 106 kg |
| 6 ft 3 in | 190 cm | 148–199 lb | 67–90 kg | 200 lb / 91 kg | 240 lb / 109 kg |
| 6 ft 4 in | 193 cm | 152–205 lb | 69–93 kg | 205 lb / 93 kg | 246 lb / 112 kg |
| 6 ft 5 in | 196 cm | 156–210 lb | 71–95 kg | 211 lb / 96 kg | 253 lb / 115 kg |
| 6 ft 6 in | 198 cm | 160–215 lb | 73–98 kg | 216 lb / 98 kg | 260 lb / 118 kg |
Calculated with BMI = weight in kilograms ÷ height in metres squared. Values are rounded to whole pounds and kilograms.
- • CDC adult BMI categories apply to people age 20 and older.
- • The upper healthy-weight value uses BMI 24.9; the next category begins at BMI 25.0.
- • BMI does not distinguish fat, muscle, bone, pregnancy, edema, or body-fat distribution.
Download or export
Adult BMI Category Chart
Adult BMI combines height and weight into a screening number. Health assessment should also consider medical history, waist size, body composition, symptoms, and trends.
Swipe horizontally inside the table to view every column.
| Adult category | BMI range | What the label means | Practical interpretation |
|---|---|---|---|
| Underweight | Below 18.5 | Weight is low relative to height on the BMI scale | Review nutrition, health history, symptoms, and unintended change rather than assuming one cause |
| Healthy weight | 18.5 to less than 25 | Falls within the standard adult screening range | Does not guarantee health or describe body-fat distribution |
| Overweight | 25 to less than 30 | Weight is higher relative to height on the BMI scale | Consider waist size, cardiometabolic risk, fitness, medication, and body composition |
| Obesity, class 1 | 30 to less than 35 | Meets the BMI definition of obesity | Use respectful, individualized clinical risk assessment |
| Obesity, class 2 | 35 to less than 40 | Higher BMI obesity category | Health risks and treatment choices vary by person |
| Obesity, class 3 | 40 or greater | Severe-obesity BMI category | A comprehensive medical assessment is more informative than the chart alone |
- • Adult categories are not used for children and teens.
- • BMI is a screening tool, not a direct measurement of body fat or a diagnosis.
- • Population-specific guidance may supplement standard BMI categories in some clinical settings.
Download or export
Illustrative adult relationship
The same BMI range produces different weights at different heights
These examples show the calculated weight corresponding to adult BMI 18.5–24.9. They are not ideal-weight prescriptions and do not apply to children.
152 cm
5 ft 0 in
95–127 lb
43–58 kg at BMI 18.5–24.9
168 cm
5 ft 6 in
115–154 lb
52–70 kg at BMI 18.5–24.9
183 cm
6 ft 0 in
136–184 lb
62–83 kg at BMI 18.5–24.9
Browser-only educational tool
Adult Height, Weight and BMI Calculator
Calculate adult BMI, convert units, and see the weight range that corresponds to BMI 18.5–24.9 at the entered height. No information is stored.
Calculated adult BMI
24.2
Healthy-weight screening range
BMI 18.5–24.9 at this height
114.6–154.3 lb
52–70 kg
Converted measurement
167.6 cm
68 kg / 150 lb
Child Height and Weight Chart Selection
Children need sex- and age-specific growth charts. A single adult height-to-weight table cannot evaluate a growing child.
Swipe horizontally inside the table to view every column.
| Age or context | Measurements to plot | Reference commonly used in the U.S. | Key interpretation point |
|---|---|---|---|
| Birth to under 2 years | Weight-for-age, length-for-age, weight-for-length, head circumference | WHO Child Growth Standards | Use recumbent length; track repeated measurements and feeding or medical context |
| Age 2 through 20 years | Stature-for-age, weight-for-age, BMI-for-age | CDC 2000 Growth Charts | BMI is interpreted by age and sex percentile, not adult cutoffs |
| Age 2 through 20 with very high BMI | BMI-for-age beyond the 97th percentile | CDC 2022 Extended BMI-for-Age Charts | Extended curves support monitoring but do not replace clinical assessment |
| Transition near age 2 | Standing height replaces recumbent length; BMI-for-age replaces weight-for-length | Transition from WHO to CDC charts | A percentile may shift because the chart and measurement method change |
| Preterm infant | Weight, length, and head circumference using corrected age when appropriate | Preterm-specific clinical tools before standard charts | Gestational age and neonatal course matter |
| Child unable to stand reliably | Alternative length or height method plus weight | Clinical protocol appropriate to mobility and condition | Document the method so future measurements are comparable |
- • Growth charts contribute to an overall clinical impression and are not sole diagnostic instruments.
- • Use exact age, accurate measurements, and the correct sex-specific chart.
- • A trend across visits is usually more informative than one isolated percentile.
Download or export
Children need the correct chart for their age
CDC recommends WHO standards from birth to under age 2 and CDC charts from age 2 through 20 in the United States. The transition changes both the reference and the measurement from recumbent length to standing height, so a percentile shift needs cautious interpretation.
Child and Teen BMI-for-Age Category Chart
For ages 2–19, BMI is interpreted relative to children of the same age and sex. Adult BMI categories do not apply.
Swipe horizontally inside the table to view every column.
| Category | BMI-for-age definition | What it screens for | Next step |
|---|---|---|---|
| Underweight | Less than the 5th percentile | Low BMI relative to age and sex | Review growth trajectory, intake, symptoms, and medical history |
| Healthy weight | 5th percentile to less than the 85th percentile | BMI within the broad reference band | Continue routine growth monitoring |
| Overweight | 85th percentile to less than the 95th percentile | Higher BMI relative to age and sex | Assess family history, blood pressure, lifestyle, and trend without stigma |
| Obesity | 95th percentile or greater | BMI at or above the obesity threshold | Use comprehensive pediatric assessment and appropriate follow-up |
| Severe obesity | 120% of the 95th percentile or greater, or BMI 35 kg/m² or greater | Very high BMI requiring extended-chart interpretation | Use CDC extended BMI charts and individualized clinical care |
- • Exact age can materially change a percentile calculation.
- • The percentile is a screening result, not a diagnosis or a judgment about a child.
- • Children should not be placed on adult calorie or weight-loss plans without appropriate professional guidance.
Download or export
Accurate Height and Weight Measurement Chart
Small technique differences can change BMI, percentiles, medication calculations, and trend interpretation.
Swipe horizontally inside the table to view every column.
| Measurement | Recommended setup | Technique | Common error |
|---|---|---|---|
| Infant weight | Calibrated infant scale on a stable surface | Remove heavy clothing and diaper when the clinical protocol requires; keep the infant safe and centered | Holding the infant on an adult scale or subtracting two imprecise readings |
| Recumbent length | Infant length board with two trained people when possible | Head against the fixed board, body straight, legs extended, feet flat against the footboard | Using a flexible tape or allowing bent knees |
| Standing child height | Firm floor and flat wall or stadiometer | No shoes; feet flat; legs straight; shoulders level; look straight ahead | Carpet, molding, shoes, hair accessories, or looking up or down |
| Standing adult height | Calibrated stadiometer when available | No shoes; heels stable; stand tall without stretching; head positioned consistently | Using a wall mark, soft tape, or estimating from an old record |
| Body weight | Calibrated digital or beam scale on hard, level flooring | Use light clothing, empty pockets, and consistent timing when tracking trends | Uneven flooring, different scales, heavy clothing, or comparing unlike conditions |
| Serial tracking | Same equipment and method when possible | Record date, time, clothing, illness, swelling, pregnancy, and relevant context | Reacting to one reading without checking technique or trend |
- • For home trends, consistency often matters more than false precision.
- • Recheck an unexpected value before interpreting it.
- • Clinical measurements may use more standardized equipment and protocols than home measurements.
Download or export
Measurement error can change the category
CDC advises measuring a child without shoes on firm flooring against a flat surface, with feet flat, legs straight, shoulders level, and the head looking straight ahead. Recheck unexpected measurements before interpreting a percentile or BMI.
Height and Weight Unit Conversion Chart
Use exact factors for calculation, then round only to the precision justified by the original measurement.
Swipe horizontally inside the table to view every column.
| Conversion | Factor | Example | Rounding note |
|---|---|---|---|
| Inches to centimetres | 1 in = 2.54 cm exactly | 66 in = 167.64 cm | A height recorded to the nearest inch is usually reported as about 168 cm |
| Feet to centimetres | 1 ft = 30.48 cm exactly | 5 ft = 152.4 cm | Add the inch portion before rounding |
| Centimetres to inches | 1 cm ≈ 0.393701 in | 170 cm ≈ 66.93 in | Convert to feet and remaining inches only after calculating total inches |
| Pounds to kilograms | 1 lb = 0.45359237 kg exactly | 150 lb ≈ 68.04 kg | Whole-pound input usually does not justify many decimal places |
| Kilograms to pounds | 1 kg ≈ 2.20462 lb | 70 kg ≈ 154.32 lb | Round consistently when comparing trends |
| Stones to pounds and kilograms | 1 st = 14 lb ≈ 6.35029 kg | 11 st = 154 lb ≈ 69.85 kg | Do not confuse decimal stones with stones-and-pounds notation |
- • BMI calculations are least error-prone when using kilograms and metres.
- • Do not mix centimetres with metres in the BMI formula.
- • Keep the unrounded value during calculation and round the final display.
Download or export
Height and Weight Interpretation Limitations
The same height, weight, or BMI can carry different meaning depending on age, body composition, health, and measurement context.
Swipe horizontally inside the table to view every column.
| Context | Why the chart can mislead | Better information to add | Practical caution |
|---|---|---|---|
| High muscularity | BMI may classify muscular weight as excess fat | Waist size, body composition, fitness, and clinical risk factors | Do not assume a high BMI describes fat mass |
| Pregnancy | Expected weight change reflects fetus, placenta, blood volume, and fluid as well as tissue | Pre-pregnancy BMI, gestational age, obstetric guidance, symptoms | Do not use a nonpregnant adult range as a pregnancy target |
| Fluid retention or edema | Rapid weight gain may be fluid rather than fat | Swelling, breathlessness, urine changes, heart, kidney, liver, and pregnancy context | Rapid gain with symptoms needs medical assessment |
| Older age or frailty | Loss of muscle can occur without a low BMI | Strength, function, appetite, unintentional loss, and medical review | A stable BMI can hide declining muscle mass |
| Amputation or inability to stand | Standard height, weight, and BMI formulas may not be directly comparable | Condition-specific methods and documented measurement technique | Use individualized clinical interpretation |
| Children and teens | Adult cutoffs ignore normal growth and puberty | Exact age, sex, percentile trajectory, family growth pattern | Use BMI-for-age and growth charts |
| Body-fat distribution | BMI does not measure abdominal fat | Waist circumference and metabolic risk factors | Two people with the same BMI may have different risk |
| One isolated reading | Hydration, meals, clothing, time, and scale error change weight | Repeated comparable measurements and symptoms | Confirm the value before acting |
- • BMI and height-weight charts are screening tools, not comprehensive health assessments.
- • Use respectful, non-stigmatizing language and focus on health, function, and trends.
- • Clinical decisions should not rely on one number alone.
Download or export
Height and weight are only part of health assessment
NIDDK recommends considering both BMI and waist size when assessing adult weight-related risk. Blood pressure, laboratory results, fitness, sleep, symptoms, medical history, medication, and body composition can materially change the clinical picture.
Height and Weight Warning Signs and Next Steps
Unexpected change, associated symptoms, and growth trajectory determine urgency more than whether a number sits inside a chart band.
Swipe horizontally inside the table to view every column.
| Finding | Suggested action | Urgency | Why it matters |
|---|---|---|---|
| Unexplained loss of 10 lb, 4.5 kg, or about 5% of usual weight within 6–12 months or less | Arrange medical assessment | Prompt review | Illness, medication, nutrition, mental health, or other causes may need evaluation |
| Rapid weight gain with swelling, shortness of breath, chest symptoms, or reduced urine | Seek urgent medical advice; call emergency services for severe breathing or chest symptoms | Urgent or emergency | Fluid retention can signal serious heart, kidney, liver, pregnancy, or medication problems |
| Child stops gaining, loses weight, or crosses growth channels repeatedly | Contact the child’s clinician and bring prior measurements | Prompt pediatric review | Growth faltering can reflect intake, absorption, endocrine, chronic disease, or measurement issues |
| New fixation on weight, shape, food restriction, bingeing, purging, or compulsive exercise | Seek medical and mental-health assessment | Prompt review | Eating disorders are serious illnesses and can occur at any body size |
| Pregnancy with sudden swelling, severe headache, vision change, breathing difficulty, or sudden weight gain | Contact maternity care urgently or use emergency services for severe symptoms | Urgent | These can accompany preeclampsia or another serious condition |
| Unexpected height loss, back pain, or stooped posture | Discuss with a clinician | Clinical review | Measurement error, vertebral compression, osteoporosis, or posture change may contribute |
| One surprising home reading without symptoms | Repeat under the same conditions and check the scale or technique | Usually verify | A single value may reflect equipment or measurement error |
| Stable, expected trend with no concerning symptoms | Continue routine monitoring appropriate to age and health | Routine | Trends are most useful when measured consistently |
- • Never delay emergency care to repeat a measurement.
- • Do not begin restrictive dieting for a child or medically vulnerable person based on this chart.
- • Local emergency numbers and care pathways vary by country.
Download or export
Unexpected weight change deserves context, not self-diagnosis
MedlinePlus advises medical review for unexplained loss of 10 pounds, 4.5 kilograms, or about 5% of usual body weight over 6 to 12 months or less. Rapid gain with swelling or breathing symptoms may reflect fluid and can require urgent assessment.
Frequently asked questions
What is a healthy weight for my height?
For adults age 20 and older, a commonly used screening range is the weight that corresponds to BMI 18.5–24.9. It is not an ideal-weight prescription and may be incomplete for pregnancy, high muscularity, edema, frailty, or other special contexts.
Can I use this adult height and weight chart for a child?
No. Children and teens need sex- and age-specific growth charts and BMI-for-age percentiles. Adult BMI cutoffs do not account for growth or puberty.
How is BMI calculated?
Metric BMI equals weight in kilograms divided by height in metres squared. The U.S. customary formula is 703 times weight in pounds divided by height in inches squared.
Does a healthy BMI mean I am healthy?
Not necessarily. BMI is a screening measure and does not directly measure body fat, fitness, blood pressure, glucose, lipids, muscle mass, or abdominal fat.
Why does the chart show a range instead of one ideal weight?
There is no single universally correct weight for a given height. The range reflects the adult BMI screening band, while health also depends on body composition, history, symptoms, function, and risk factors.
Why can my weight change from day to day?
Fluid, salt, carbohydrate stores, meals, bowel contents, clothing, menstrual changes, time of day, and scale variation can all move a short-term reading.
How should I measure height at home?
Remove shoes, use a hard floor and flat vertical surface, stand straight with the head level, and use a rigid right-angle headpiece. A calibrated stadiometer is more reliable when available.
How should I measure weight for a trend?
Use the same reliable scale on hard level flooring under similar conditions, such as similar clothing and time of day. Record context and recheck unexpected values.
What chart is used for babies?
In the United States, CDC recommends WHO growth standards from birth to under age 2, including weight-for-age, length-for-age, weight-for-length, and head circumference.
What chart is used from age 2 to 20?
CDC growth charts are commonly used in the United States for stature-for-age, weight-for-age, and BMI-for-age from age 2 through 20.
Can athletes rely on BMI-based weight ranges?
BMI may overstate body fat in highly muscular people. Waist size, body composition, performance, medical history, and metabolic risk can add context.
Does pregnancy change how weight should be interpreted?
Yes. Pregnancy weight includes expected changes in the fetus, placenta, blood volume, fluid, and tissues. Use obstetric guidance rather than a nonpregnant adult chart.
When is unintentional weight loss concerning?
MedlinePlus advises contacting a health professional for unexplained loss of 10 pounds, 4.5 kilograms, or about 5% of usual body weight over 6 to 12 months or less, especially with other symptoms.
Can rapid weight gain be caused by fluid?
Yes. Rapid gain with swelling can reflect fluid retention. Seek prompt care when it is accompanied by breathlessness, chest symptoms, reduced urine, pregnancy warning signs, or significant illness.
Should I change my diet based only on this chart?
No. The chart is educational and cannot account for medical conditions, medications, pregnancy, eating disorders, growth, or individual nutritional needs. Use qualified clinical guidance for treatment decisions.
Sources
These sources support the visible tables, calculations, measurement guidance, interpretation notes, and safety information. URLs are shown as plain text for transparent reference.
Centers for Disease Control and Prevention — Adult BMI Categories
Defines adult BMI categories for people age 20 and older: underweight below 18.5, healthy weight 18.5 to less than 25, overweight 25 to less than 30, and obesity 30 or greater.
https://www.cdc.gov/bmi/adult-calculator/bmi-categories.html
Centers for Disease Control and Prevention — Body Mass Index
Explains that BMI is a screening measure based on weight relative to height rather than a diagnosis or direct measure of body fat.
https://www.cdc.gov/bmi/index.html
Centers for Disease Control and Prevention — What Growth Charts Are Recommended?
Recommends WHO growth standards from birth to 2 years and CDC growth references from age 2 through 20 in the United States.
https://www.cdc.gov/growth-chart-training/hcp/overview/recommended.html
Centers for Disease Control and Prevention — Plotting and Interpreting BMI-for-Age
Defines child and adolescent BMI-for-age percentile categories and severe-obesity criteria.
https://www.cdc.gov/growth-chart-training/hcp/using-bmi/plotting-interpreting-bmi.html
Centers for Disease Control and Prevention — Measuring Children’s Height and Weight
Provides practical instructions for accurate standing height and weight measurements in children and teens.
https://www.cdc.gov/bmi/child-teen-calculator/measure-child-height-weight.html
World Health Organization — Child Growth Standards
Provides international standards and training resources for measuring and interpreting child weight, length, height, and related indicators.
https://www.who.int/tools/child-growth-standards
National Institute of Diabetes and Digestive and Kidney Diseases — Am I at a Healthy Weight?
Explains that BMI and waist size are screening measures that can help assess weight-related health risk.
https://www.niddk.nih.gov/health-information/weight-management/adult-overweight-obesity/am-i-healthy-weight
National Institute of Standards and Technology — Approximate Conversions from U.S. Customary Measures to Metric
Supports customary-to-metric conversions for length and mass and appropriate rounding of converted measurements.
https://www.nist.gov/pml/owm/metric-si/unit-conversion/approximate-conversions-us-customary-measures-metric
MedlinePlus, U.S. National Library of Medicine — Weight Loss — Unintentional
Identifies unexplained loss of 10 pounds or 5% of usual body weight over 6 to 12 months or less as a reason to contact a health professional.
https://medlineplus.gov/ency/article/003107.htm
MedlinePlus, U.S. National Library of Medicine — Weight Gain — Unintentional
Explains that rapid unintentional weight gain can reflect fluid retention and may require medical assessment.
https://medlineplus.gov/ency/article/003084.htm
National Institute of Mental Health — Eating Disorders: What You Need to Know
Explains that severe disturbances in eating behavior and fixation on weight, shape, or food can signal a serious eating disorder.
https://www.nimh.nih.gov/health/publications/eating-disorders
Every table includes notes, source attribution, and controls for copying, CSV, PNG, PDF, and printing.