Finance & Money
Inflation Chart
U.S. CPI-U rose 3.5% over the 12 months ending June 2026. The index fell 0.4% from May to June after seasonal adjustment, while core CPI rose 2.6% over 12 months and was unchanged for the month.
A negative monthly CPI change does not mean the prior years of price increases disappeared. Always identify the index, period, and seasonal-adjustment basis before interpreting an inflation figure.
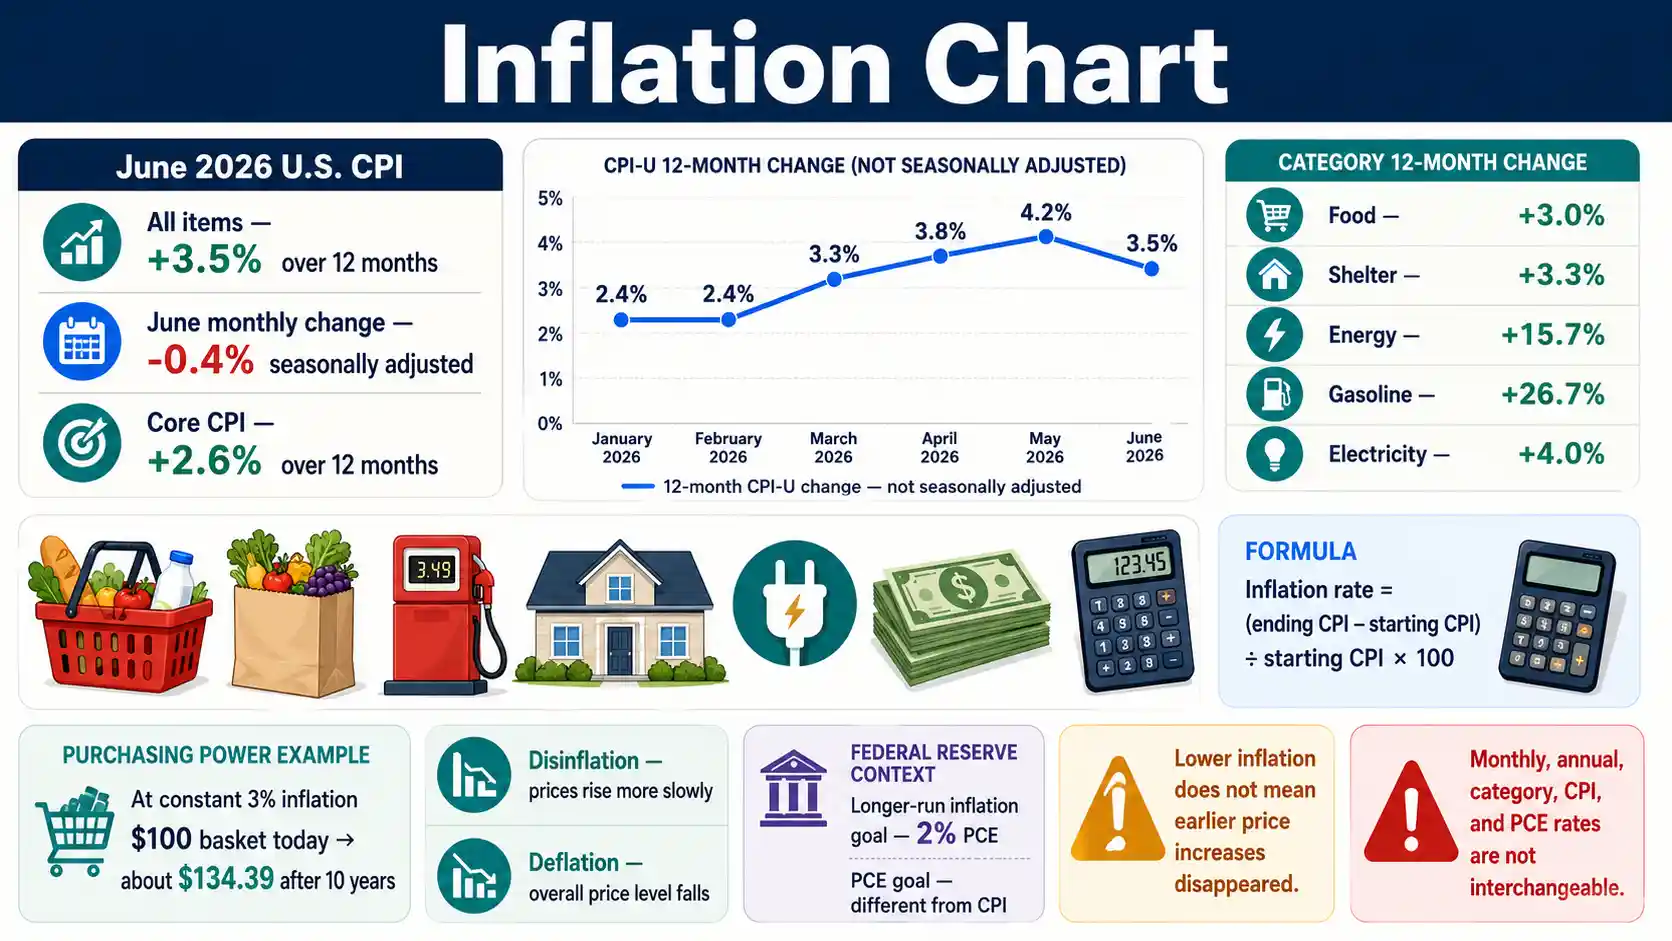
Latest 12-month CPI
3.5% in June 2026
BLS reported that CPI-U was 3.5% higher in June 2026 than in June 2025 before seasonal adjustment.
June monthly change
-0.4% seasonally adjusted
The all-items index fell from May to June, largely because energy prices declined sharply during the month.
Core CPI
2.6% over 12 months
Core CPI excludes food and energy and was unchanged on a seasonally adjusted monthly basis in June.
Key interpretation
Rate is not the price level
Lower inflation means prices are rising more slowly unless the overall price index itself is falling over the comparison period.
Direct answers to common inflation questions
What is the latest U.S. CPI inflation rate?
U.S. CPI-U rose 3.5% over the 12 months ending June 2026. The all-items index fell 0.4% from May to June on a seasonally adjusted basis.
What was core CPI inflation in June 2026?
Core CPI rose 2.6% over 12 months and was unchanged in June on a seasonally adjusted monthly basis.
How do you calculate inflation from CPI values?
Subtract the starting CPI from the ending CPI, divide by the starting CPI, and multiply by 100.
Does lower inflation mean prices fell?
No. Lower inflation usually means the price level is increasing more slowly, not that prices returned to earlier levels.
What is disinflation?
Disinflation is a decline in the inflation rate while the overall price level can continue to rise.
What is deflation?
Deflation is a broad decline in the overall price level. One negative monthly CPI reading alone does not establish sustained deflation.
Why can personal inflation differ from CPI?
Households buy different mixes of housing, food, transportation, health care, energy, and other goods and services than the national CPI basket.
What is the difference between headline and core CPI?
Headline CPI includes the full covered basket. Core CPI removes food and energy to reduce the effect of two volatile categories.
Is the Federal Reserve target 2% CPI?
No. The Federal Reserve defines its 2% longer-run inflation goal using the PCE price index, not CPI.
How does inflation reduce purchasing power?
When prices rise, a fixed dollar amount buys fewer goods and services unless income or assets grow enough to offset the increase.
Can category inflation differ from headline CPI?
Yes. In June 2026, energy prices were up 15.7% over 12 months while all-items CPI was up 3.5%.
Should monthly and 12-month CPI rates be compared directly?
No. Monthly and 12-month rates measure different time windows and may also use different seasonal-adjustment conventions.
June 2026 U.S. Inflation Snapshot
The latest completed national CPI month shows a sharp monthly energy-led decline while the 12-month all-items rate remained above the Federal Reserve's longer-run PCE inflation objective.
Swipe horizontally inside the table to view every column.
| Measure | June 2026 index or rate | Monthly change | 12-month change | How to read it |
|---|---|---|---|---|
| CPI-U, all items | 333.952 | -0.4% SA | +3.5% NSA — Latest 12-month headline CPI rate | Broad consumer-price measure for urban consumers |
| Core CPI, all items less food and energy | — | 0.0% SA | +2.6% NSA — Latest core CPI 12-month rate | Removes volatile food and energy categories |
| Food | 349.731 | +0.2% SA | +3.0% NSA | Includes food at home and food away from home |
| Energy | — | -5.7% SA | +15.7% NSA — Energy prices were sharply higher than one year earlier | Large June monthly decline, but still sharply higher year over year |
| Shelter | — | — | +3.3% NSA | Housing-related CPI category; rent and owners equivalent rent are major components |
SA = seasonally adjusted. NSA = not seasonally adjusted. CPI index base is 1982–84 = 100 unless otherwise noted.
- • BLS reported that CPI-U fell 0.4% in June 2026 on a seasonally adjusted monthly basis and rose 3.5% over 12 months before seasonal adjustment.
- • The all-items CPI index applies to the month as a whole, not to a specific date within June.
- • Do not compare the CPI 3.5% rate directly with the Federal Reserve 2% target without noting that the Fed targets PCE inflation, not CPI inflation.
Download or export
June inflation fell month to month, but the year-over-year price level was still higher
The official BLS June 2026 CPI release reports a 0.4% seasonally adjusted monthly decline and a 3.5% unadjusted 12-month increase. Those two figures describe different comparison windows and should not be treated as contradictions.
2026 CPI Inflation Trend by Month
These are 12-month percentage changes in the U.S. CPI-U, not seasonally adjusted. The table shows how headline, core, and energy inflation moved from January through June 2026.
Swipe horizontally inside the table to view every column.
| Month | All items | Core CPI | Energy | Headline direction |
|---|---|---|---|---|
| January 2026 | 2.4% | 2.5% | -0.1% | Headline below core |
| February 2026 | 2.4% | 2.5% | 0.5% | Little change |
| March 2026 | 3.3% | 2.6% | 12.5% | Headline accelerated |
| April 2026 | 3.8% | 2.8% | 17.9% | Energy pressure increased |
| May 2026 | 4.2% — Highest all-items 12-month rate in the January-to-June 2026 series | 2.9% | 23.5% | Highest headline rate in this six-month span |
| June 2026 | 3.5% — June headline inflation eased from May | 2.6% | 15.7% | Headline eased from May |
Percent change from the same month one year earlier; not seasonally adjusted.
- • A lower 12-month inflation rate means prices are rising more slowly than before; it does not mean the overall price level returned to an earlier level.
- • Headline CPI includes food and energy. Core CPI excludes food and energy.
Download or export
June 2026 Inflation by Spending Category
Price changes differed widely across categories. A household can therefore experience a personal cost change that differs from the national all-items CPI.
Swipe horizontally inside the table to view every column.
| Category | 12-month change | Relative to all-items CPI | What stands out |
|---|---|---|---|
| All items | 3.5% | Baseline | Broad CPI-U headline rate |
| Food | 3.0% | Lower | Food at home rose 2.7%; food away from home rose 3.4% |
| Fruits and vegetables | 5.3% | Higher | Above the all-items rate |
| Energy | 15.7% — Energy inflation was far above the all-items rate | Much higher | Gasoline rose 26.7% over 12 months |
| Electricity | 4.0% | Higher | Above headline CPI |
| Shelter | 3.3% | Slightly lower | Rent rose 2.8%; owners equivalent rent rose 3.3% |
| Medical care services | 2.9% | Lower | Hospital services rose 5.1% |
| Motor vehicle insurance | -4.1% — Vehicle insurance declined year over year | Lower | A year-over-year price decline |
| Airline fares | 26.5% | Much higher | Large year-over-year increase |
12-month percentage change, June 2025 to June 2026, not seasonally adjusted.
- • CPI is an average across a large basket. Your spending mix determines how strongly each category affects your household budget.
- • Category inflation can move in opposite directions at the same time.
Download or export
Annual Average U.S. CPI Inflation, 2020–2025
Annual-average inflation compares the average CPI level for one calendar year with the average level for the previous year. It is different from a December-to-December or latest-month 12-month rate.
Swipe horizontally inside the table to view every column.
| Year | Annual-average CPI-U | Annual-average inflation | $100 basket at prior-year average prices becomes |
|---|---|---|---|
| 2020 | 258.811 | 1.2% | $101.20 |
| 2021 | 270.970 | 4.7% | $104.70 |
| 2022 | 292.655 | 8.0% — Highest annual-average inflation in this 2020-to-2025 span | $108.00 |
| 2023 | 304.702 | 4.1% | $104.10 |
| 2024 | 313.689 | 2.9% | $102.90 |
| 2025 | 321.943 | 2.6% | $102.60 |
CPI-U annual average, U.S. city average, 1982–84 = 100; annual average percent change.
- • The $100 examples show one-year percentage effects only. They do not compound the six years together.
- • Annual-average inflation is not interchangeable with the latest 12-month CPI rate.
Download or export
Browser-only educational tool
CPI Inflation and Purchasing Power Calculator
Compare two compatible CPI or price-index values. The tool calculates the percentage change and the dollar amount needed at the ending index to match the starting purchasing power.
Index change
3.53%
From 322.561 to 333.952.
Equivalent ending amount
$1,035.31
Amount needed at the ending index to match $1,000.00 at the starting index.
Price-level difference
$35.31
Difference between the equivalent ending amount and the starting dollar amount.
Ending purchasing power of start amount
$965.89
Starting-index dollars represented by $1,000.00 at the ending price level.
Inflation rate: (333.952 − 322.561) ÷ 322.561 × 100 = 3.53%
Equivalent amount: $1,000.00 × (333.952 ÷ 322.561) = $1,035.31
Use values from the same price-index series and compatible periods. This calculator runs in your browser, does not transmit entered values, and does not forecast future inflation.
BLS purchasing-power comparisons use CPI-U, not a personal household basket
The BLS CPI Inflation Calculator uses the CPI-U U.S. city average all-items series, not seasonally adjusted. A household with an unusual spending mix can experience a different effective cost change.
Inflation and Purchasing Power Examples
A constant inflation rate compounds. The future amount needed to buy the same hypothetical basket equals today's cost multiplied by (1 + inflation rate) raised to the number of years.
Swipe horizontally inside the table to view every column.
| Constant annual inflation | After 1 year | After 5 years | After 10 years | After 20 years |
|---|---|---|---|---|
| 2% | $102.00 | $110.41 | $121.90 | $148.59 — Two percent inflation compounded for twenty years |
| 3% | $103.00 | $115.93 | $134.39 | $180.61 |
| 4% | $104.00 | $121.67 | $148.02 | $219.11 |
| 5% | $105.00 | $127.63 | $162.89 | $265.33 |
| 8% | $108.00 | $146.93 | $215.89 | $466.10 — High constant inflation compounds rapidly |
Future cost of a hypothetical $100 basket if a constant annual inflation rate persisted.
- • These are mathematical illustrations, not forecasts of future U.S. inflation.
- • Actual inflation varies by year, category, geography, household spending pattern, and price index.
Download or export
CPI, Core CPI, CPI-W, Chained CPI, and PCE Compared
Different inflation measures answer different questions. Always identify the index, population, adjustment, and time period before comparing rates.
Swipe horizontally inside the table to view every column.
| Measure | Produced by | Main purpose | Key distinction |
|---|---|---|---|
| CPI-U | BLS | Prices paid by urban consumers | Headline CPI most commonly reported in U.S. media |
| Core CPI | BLS | Underlying CPI trend reference | CPI-U less food and energy |
| CPI-W | BLS | Prices for urban wage earners and clerical workers | Different population weights from CPI-U |
| C-CPI-U | BLS | Chained consumer inflation measure | Reflects substitution across item categories more directly |
| PCE price index | BEA; monitored by Federal Reserve | Broad consumer spending price measure | Federal Reserve defines its 2% longer-run inflation goal using PCE — The Federal Reserve inflation goal is defined using PCE |
| Core PCE | BEA; monitored by Federal Reserve | PCE excluding food and energy | Often used to study underlying inflation pressure |
- • A 2% Federal Reserve inflation target means 2% PCE inflation over the longer run, not a requirement that CPI equal 2% every month.
- • CPI and PCE use different scopes, weights, and methods, so their reported inflation rates can differ.
Download or export
The Federal Reserve 2% goal is a PCE goal, not a CPI cutoff
The Federal Reserve inflation overview states that policymakers seek 2% inflation over the longer run as measured by the annual change in the PCE price index. CPI and PCE are related measures, but they are constructed differently and can report different rates.
Common Inflation Chart Mistakes and Better Comparisons
Inflation data can be misread when monthly, annual, cumulative, seasonally adjusted, and category-specific figures are treated as interchangeable.
Swipe horizontally inside the table to view every column.
| Mistake | Why it misleads | Better approach | Example |
|---|---|---|---|
| Treating lower inflation as lower prices | Disinflation means prices rise more slowly, not necessarily fall | Separate inflation rate from price level | 3% inflation still means an average price level is rising |
| Comparing monthly SA with 12-month NSA directly | They use different periods and adjustment methods | Match period and adjustment before comparison | June 2026: -0.4% monthly SA vs +3.5% over 12 months NSA — Monthly and annual CPI figures are different measures |
| Calling one category the inflation rate | Category prices can diverge widely | Use all-items CPI for broad CPI inflation | Energy +15.7% vs all items +3.5% in June 2026 |
| Assuming CPI equals personal inflation | Households have different spending mixes | Build a household budget comparison | A heavy gasoline spender may feel energy moves more strongly |
| Using the Fed 2% target as a CPI threshold | The target is defined using PCE | Name the price index explicitly — Federal Reserve target uses PCE rather than CPI | 2% longer-run PCE goal |
| Ignoring compounding | Repeated inflation changes build on prior price levels | Compound sequential rates | 5% for 10 years raises a $100 basket to about $162.89 |
| Annualizing one volatile month | One month may contain temporary shocks | Use longer trends and official 12-month measures | Energy can swing sharply month to month |
- • Inflation interpretation depends on the index definition and measurement window.
- • For contractual escalation, tax, benefits, or legal uses, follow the specific index and rules named in the governing document or program.
Download or export
Limits, special cases, and inflation figures that need more context
Local prices can diverge from national CPI
National CPI-U is not a quote for one city, store, household, or product. Local price indexes also have smaller samples and can be more volatile.
Asset prices are not consumer inflation
Stocks, bonds, existing homes, and other asset prices are not interchangeable with the CPI basket of consumer goods and services.
Benefit and contract adjustments use specific rules
A benefit, lease, wage agreement, or legal document may name CPI-W, CPI-U, a local index, a reference month, or a custom formula. Use the specified rule rather than a generic chart.
Future inflation is uncertain
Constant-rate examples explain compounding but are not forecasts. Energy shocks, housing costs, supply conditions, demand, policy, and many other factors can alter future inflation.
For contracts, taxes, benefits, investment decisions, or financial planning that depend on inflation, verify the exact index and official source required for that decision.
Frequently asked questions
What is the U.S. inflation rate right now?
The latest completed CPI report shows U.S. CPI-U up 3.5% over the 12 months ending June 2026. The index fell 0.4% from May to June on a seasonally adjusted basis.
What was core inflation in June 2026?
Core CPI, which excludes food and energy, rose 2.6% over the 12 months ending June 2026 and was unchanged from May on a seasonally adjusted monthly basis.
Does falling inflation mean prices are falling?
No. Falling inflation usually means prices are increasing more slowly. Prices fall broadly only during deflation, when the overall price level declines.
How do I calculate inflation between two CPI values?
Subtract the starting CPI from the ending CPI, divide by the starting CPI, and multiply by 100. The CPI values must refer to compatible indexes and periods.
How does inflation affect purchasing power?
Inflation reduces the amount of goods and services a fixed dollar amount can buy when prices rise faster than that dollar amount grows.
What is the difference between CPI and core CPI?
Headline CPI includes all covered consumer categories. Core CPI removes food and energy to reduce the influence of two categories that can be especially volatile.
Is the Federal Reserve inflation target 2% CPI?
No. The Federal Reserve seeks 2% inflation over the longer run as measured by the annual change in the PCE price index, not CPI.
Why can my personal inflation rate differ from CPI?
Your household buys a different mix of goods and services than the national CPI basket. Geography, housing, transportation, health care, food, and energy spending can change your experience.
What does seasonally adjusted inflation mean?
Seasonal adjustment removes recurring seasonal price patterns so short-term monthly changes can be compared more meaningfully across the year.
What does a 3.5% 12-month CPI rate mean?
It means the CPI-U all-items index was 3.5% higher in June 2026 than in June 2025. It does not mean every item rose 3.5%.
How do I adjust a past dollar amount for CPI inflation?
Multiply the past amount by the ending CPI and divide by the starting CPI. BLS uses the CPI-U U.S. city average all-items series in its public inflation calculator.
Can one month of CPI predict future inflation?
No. One month can be heavily influenced by volatile categories or temporary shocks. Use longer trends and multiple measures before drawing conclusions about future inflation.
What is disinflation?
Disinflation is a decline in the inflation rate while the overall price level can still be rising. It is different from deflation.
What is deflation?
Deflation is a broad decline in the overall price level. A negative monthly CPI change alone does not establish a sustained period of economy-wide deflation.
Should I use CPI to escalate a contract or payment?
Use the exact index, geography, adjustment basis, reference month, and formula specified by the contract or governing rule. Similar CPI series are not automatically interchangeable.
Sources
These official sources support the CPI values, historical inflation figures, purchasing-power method, and inflation-measure distinctions on this page.
U.S. Bureau of Labor Statistics — Consumer Price Index — June 2026
https://www.bls.gov/news.release/cpi.htm
Official June 2026 CPI release with CPI-U index levels, seasonally adjusted monthly changes, unadjusted 12-month changes, and detailed expenditure categories.
U.S. Bureau of Labor Statistics — CPI Inflation Calculator
https://www.bls.gov/data/inflation_calculator.htm
Explains the BLS inflation calculator, which uses the CPI-U U.S. city average for all items, not seasonally adjusted, to compare purchasing power across periods.
U.S. Bureau of Labor Statistics — CPI-U annual average historical table
https://www.bls.gov/regions/mid-atlantic/data/ConsumerPriceIndexAnnualandSemiAnnual_Table.htm
Official BLS table with U.S. city average CPI-U annual-average index levels and annual-average percent changes through 2025.
Federal Reserve Board — Inflation (PCE)
https://www.federalreserve.gov/economy-at-a-glance-inflation-pce.htm
Explains that the Federal Reserve seeks 2 percent inflation over the longer run as measured by the annual change in the PCE price index, not CPI.