Finance & Money
Investment Return Chart
Investment return measures how much an investment gained or lost relative to the money invested. Total return includes value change and investment income, while annualized return converts a multi-year result into an equivalent compound yearly rate.
Return is not the same as a forecast. Historical performance, hypothetical growth rates, and annualized results do not guarantee future investment outcomes.
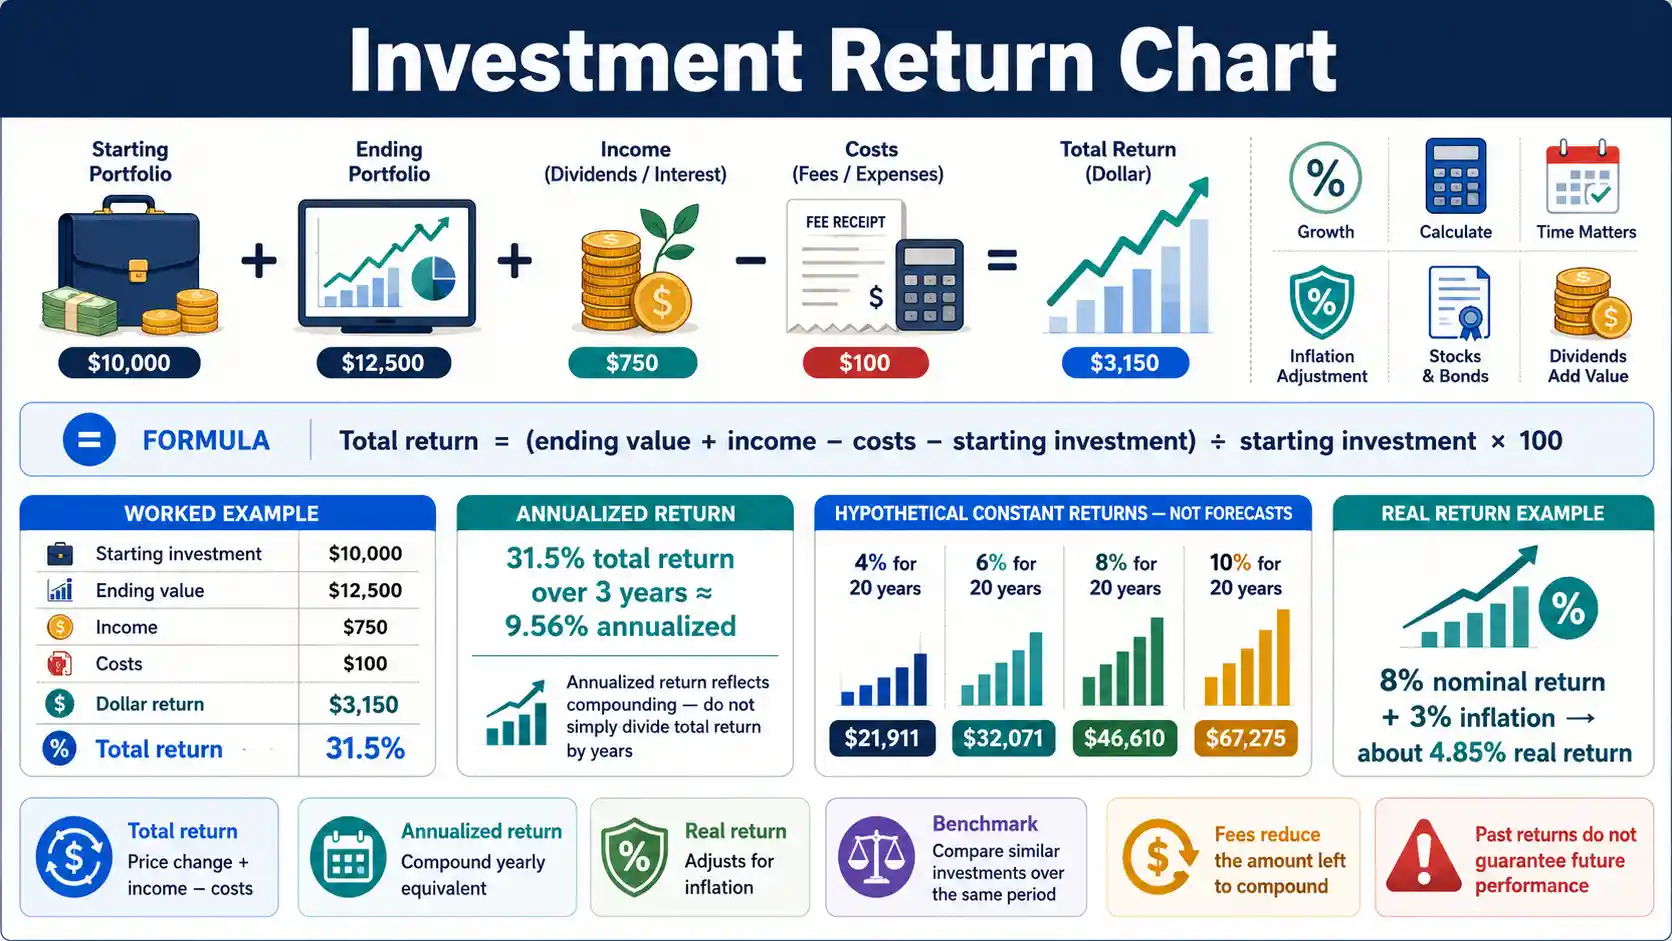
Total return
Price change + income − costs
Total return measures the full gain or loss across the holding period rather than price movement alone.
Annualized return
Compound yearly equivalent
Annualization standardizes multi-year performance so different holding periods can be compared more consistently.
Fees matter
Net return can differ materially
Investment costs reduce the amount left to compound and can create a large long-term difference.
Real return
Purchasing power matters
Inflation can reduce the real value of a positive nominal return, especially across long horizons.
Direct answers to common investment return questions
How do you calculate investment return?
Add the change in investment value and investment income, subtract relevant costs, then divide the gain or loss by the starting investment.
What is total return?
Total return is the full gain or loss over a holding period, including price change and income such as dividends or interest.
What is annualized return?
Annualized return converts multi-year performance into an equivalent compound annual rate, making different holding periods easier to compare.
Is CAGR the same as annualized return?
For a beginning value, ending value, and period with no external cash flows, CAGR is the annualized compound rate linking those values.
Should dividends count in investment return?
Yes. A total-return calculation should include dividends, interest, or other investment income that belongs to the holding period.
Should fees count in investment return?
Yes when measuring the investor result. Transaction costs and ongoing expenses reduce net investment performance.
Can positive income still produce a negative return?
Yes. An investment can pay income while losing more value than the income received, leaving total return negative.
What is real return?
Real return adjusts nominal performance for inflation and focuses on whether purchasing power increased or decreased.
Why not divide total return by years?
Simple division ignores compounding. Annualized return uses a compound-rate formula instead.
How do contributions affect return calculations?
Deposits and withdrawals change the result because timing matters. A time-weighted or money-weighted method may be more appropriate.
Does a high historical return predict future return?
No. Historical performance does not guarantee future results and does not capture all risks, costs, or market conditions.
What benchmark should an investment use?
Use a benchmark with a similar asset class, risk exposure, and measurement period so the comparison is meaningful.
Investment Return Formulas at a Glance
Different return measures answer different questions. Use the formula that matches the investment, holding period, cash flows, fees, and comparison you are trying to make.
Swipe horizontally inside the table to view every column.
| Measure | Formula or method | Best use | Main limitation |
|---|---|---|---|
| Dollar return | Ending value + income − starting value − costs | Shows dollars gained or lost | Does not scale results to investment size |
| Total return % | Dollar return ÷ starting investment × 100 — Core holding-period return formula | Measures full holding-period return | Does not standardize different holding periods |
| Annualized return / CAGR | (Ending value ÷ beginning value)^(1 ÷ years) − 1 — Compound annualized return formula | Compares multi-year growth on an annual compound basis | Simple form assumes no external cash flows |
| Real return | (1 + nominal return) ÷ (1 + inflation) − 1 | Estimates change in purchasing power | Taxes and personal inflation may differ |
| After-fee return | Return after applicable investment costs | Shows investor experience more realistically | Fee timing and structure can vary |
| Income yield | Annual income ÷ current or specified value | Measures income rate | Yield alone omits price gains or losses |
- • Total return should generally include price change plus distributions such as dividends or interest and should account for relevant investment costs when measuring the investor result.
- • Annualized return is not the same as dividing total return by the number of years because annualization reflects compounding.
Download or export
Total return includes more than price appreciation
FINRA explains that investment performance should account for the total investment cost and, for stocks, both price appreciation and dividend income. Its investment-return guidance also explains why annualized return is more useful than simply dividing a multi-year total return by the number of years.
Total Return Examples With Income and Costs
These hypothetical examples show why price change alone can misstate investment performance when income or costs are present.
Swipe horizontally inside the table to view every column.
| Starting investment | Ending value | Income received | Costs | Dollar return | Total return |
|---|---|---|---|---|---|
| $10,000 | $11,000 | $300 | $100 | $1,200 | 12.0% |
| $10,000 | $12,000 | $400 | $100 | $2,300 | 23.0% |
| $10,000 | $9,500 | $600 | $100 | $0 | 0.0% — Income offsets the decline and costs in this example |
| $10,000 | $9,000 | $400 | $100 | -$700 | -7.0% — Negative total return despite investment income |
| $25,000 | $27,000 | $1,000 | $250 | $2,750 | 11.0% |
Hypothetical USD examples. Costs represent total modeled transaction or investment costs included in the example.
- • Formula used: dollar return = ending value + income − starting investment − costs.
- • A positive dividend does not guarantee a positive total return if the investment value falls enough.
Download or export
Annualized Return From Total Growth and Holding Period
The same holding-period return becomes a different annualized return depending on how long the investment took to produce that result.
Swipe horizontally inside the table to view every column.
| Total return | Holding period | Ending multiple | Annualized return | Why it matters |
|---|---|---|---|---|
| 10% | 1 year | 1.10× | 10.00% | One-year total and annualized return match |
| 25% | 2 years | 1.25× | 11.80% | Compounding standardizes the two-year result |
| 25% | 5 years | 1.25× | 4.56% | Same total gain spread over a longer period |
| 50% | 5 years | 1.50× | 8.45% | Annualized rate is lower than 50% ÷ 5 |
| 100% | 10 years | 2.00× | 7.18% — Annualized rate for a ten-year doubling | Doubling over ten years equals about 7.18% annualized |
| -20% | 4 years | 0.80× | -5.43% — Annualized loss example | Losses can also be annualized |
- • Annualized return here uses (1 + total return)^(1/years) − 1 and assumes no external contributions or withdrawals during the period.
- • Portfolios with material cash flows may require a money-weighted return, time-weighted return, or another performance method.
Download or export
Browser-only educational tool
Total, Annualized, and Real Return Calculator
Estimate a lump-sum holding-period return from beginning value, ending value, investment income, costs, time, and an inflation assumption. Do not use this simple annualization when material deposits or withdrawals occurred during the period.
Dollar return
$3,150.00
Ending value plus income, minus starting investment and modeled costs.
Total return
31.50%
Full modeled holding-period return relative to the starting investment.
Annualized return
9.56%
Compound annualized result for 3 years, assuming no external cash flows.
Inflation-adjusted annualized return
6.37%
Exact annualized return adjusted by the entered inflation assumption.
Dollar return: $12,500.00 + $750.00 − $100.00 − $10,000.00 = $3,150.00
Total return: $3,150.00 ÷ $10,000.00 × 100 = 31.50%
This tool runs in your browser and transmits no entered values. It is an educational lump-sum model, not an investment recommendation, return forecast, tax calculation, or substitute for the performance method used by your broker, fund, or adviser.
Hypothetical Growth of $10,000 at Constant Annual Returns
Compounding causes long-term outcomes to spread apart as the assumed annual return and investment horizon increase.
Swipe horizontally inside the table to view every column.
| Annual return | 5 years | 10 years | 20 years | 30 years |
|---|---|---|---|---|
| 4% | $12,166.53 | $14,802.44 | $21,911.23 | $32,433.98 |
| 6% | $13,382.26 | $17,908.48 | $32,071.35 | $57,434.91 |
| 8% | $14,693.28 | $21,589.25 | $46,609.57 | $100,626.57 — Long-term compound-growth example at an assumed 8% return |
| 10% | $16,105.10 | $25,937.42 | $67,275.00 | $174,494.02 |
Hypothetical USD. Assumes one initial $10,000 investment, annual compounding, no taxes, no fees, no contributions, and a constant return.
- • These values demonstrate arithmetic compounding and are not forecasts or promised investment results.
- • Real investments fluctuate. A smooth constant-return path can materially understate uncertainty and sequence risk.
Download or export
Small recurring fees can create a large long-term performance gap
The SEC investor bulletin on fees and investment expenses explains that costs that appear small can materially affect portfolio value over time because money paid in fees is no longer available to compound.
How Annual Fees Can Reduce Long-Term Portfolio Growth
This simplified hypothetical starts with $100,000, assumes a constant 7% gross annual return, and subtracts the stated annual fee from the modeled return before compounding.
Swipe horizontally inside the table to view every column.
| Modeled annual fee | Modeled net annual rate | Value after 20 years | Difference vs no-fee example |
|---|---|---|---|
| 0.00% | 7.00% | $386,968.45 | $0 |
| 0.25% | 6.75% | $369,281.60 | -$17,686.84 |
| 0.50% | 6.50% | $352,364.51 | -$34,603.94 |
| 1.00% | 6.00% | $320,713.55 | -$66,254.90 — Illustrative long-term difference from a one-percentage-point annual fee |
Hypothetical USD. Simplified annual-rate model; actual fee calculation, timing, trading costs, taxes, and returns can differ.
- • The SEC warns that even small ongoing fees can have a major long-term impact because fees reduce the amount remaining in the portfolio to compound.
- • Do not compare products only on return. Review expense ratios, advisory fees, transaction costs, sales charges, and other applicable expenses.
Download or export
Nominal return and purchasing-power return are different
Investor.gov defines real return as return after accounting for inflation and taxes. The chart below isolates inflation so you can see how purchasing-power growth differs from nominal performance.
Nominal Return Versus Inflation-Adjusted Real Return
Real return helps estimate purchasing-power growth. The exact multiplicative formula is more precise than simply subtracting inflation from nominal return.
Swipe horizontally inside the table to view every column.
| Nominal return | Inflation | Exact real return | Simple subtraction | Interpretation |
|---|---|---|---|---|
| 4% | 2% | 1.96% | 2.00% | Small difference at moderate rates |
| 6% | 3% | 2.91% | 3.00% | Purchasing power rises more slowly than nominal value |
| 8% | 3% | 4.85% | 5.00% | Exact formula accounts for compounding interaction |
| 10% | 5% | 4.76% | 5.00% | High inflation reduces real growth materially |
| 3% | 5% | -1.90% — Purchasing-power loss despite a positive nominal return | -2.00% | Positive nominal return can still lose purchasing power |
Real return = (1 + nominal return) ÷ (1 + inflation rate) − 1.
- • Investor.gov describes real return as return after accounting for inflation and taxes. This table isolates inflation only so the arithmetic remains transparent.
- • Your personal cost-of-living change and tax situation can differ from a broad inflation measure.
Download or export
Which Investment Return Metric Should You Use?
The right metric depends on whether you are measuring a security, a portfolio, a personal account with cash flows, or purchasing power.
Swipe horizontally inside the table to view every column.
| Metric | Use it when | Include or control for | Common mistake |
|---|---|---|---|
| Total return | You want the full gain or loss over one holding period | Price change, income, relevant costs | Looking only at price appreciation |
| Annualized return / CAGR | You compare investments held for different multi-year periods | Beginning value, ending value, time | Dividing total return by years |
| Time-weighted return | You evaluate manager or strategy performance across external cash flows — Useful for strategy performance when external cash flows occur | Subperiod returns around deposits and withdrawals | Treating investor cash-flow timing as manager performance |
| Money-weighted return / IRR | You evaluate the investor experience with dated cash flows — Useful for the investor experience when cash-flow timing matters | Timing and size of contributions and withdrawals | Comparing it directly with a benchmark without context |
| Real return | You want purchasing-power growth | Nominal return and inflation; taxes when applicable | Calling nominal growth real wealth growth |
| After-fee return | You compare what remains after investment costs | Expense ratios, advisory fees, transaction costs, sales charges | Comparing gross return with net return |
| Benchmark-relative return | You judge performance against a relevant market reference | Same period, similar asset class and risk exposure | Using an unrelated benchmark |
- • Fund shareholder reports commonly show average annual total returns over standardized periods alongside a broad-based market index.
- • No single return metric captures risk, volatility, taxes, liquidity, or whether an investment is suitable for a particular investor.
Download or export
Limits, special cases, and return figures that need more context
Cash-flow timing can invalidate simple CAGR
If you made significant contributions or withdrawals, a simple beginning-to-ending annualized return can mix investment performance with investor cash-flow timing.
Taxes depend on the account and transaction
Taxable accounts, retirement accounts, realized gains, losses, dividends, interest, and holding periods can produce different after-tax outcomes.
Risk is not visible in return alone
Two investments can report the same annualized return while having very different volatility, drawdowns, concentration, liquidity, and downside risk.
Constant-return examples are not market forecasts
Smooth 4%, 6%, 8%, or 10% growth paths illustrate compounding. Actual investment returns vary and can be negative in individual periods.
Use official statements or fund reports for reported performance and confirm whether returns are gross or net of fees, include reinvested distributions, and use a time-weighted or money-weighted method before comparing results.
Frequently asked questions
How do I calculate investment return?
Add the change in investment value and income, subtract relevant costs, then divide the resulting gain or loss by the starting investment to express total return as a percentage.
What is total return?
Total return measures the full gain or loss over a holding period, including price change and investment income such as dividends or interest.
What is annualized return?
Annualized return converts a multi-period result into an equivalent compound annual growth rate so investments held for different lengths of time can be compared more consistently.
Is annualized return the same as average annual return?
Not always. A simple arithmetic average of yearly returns can differ from the compounded annualized return produced by beginning and ending values.
What is CAGR?
CAGR is compound annual growth rate. For a beginning value, ending value, and time period with no intervening cash flows, CAGR is the annualized rate that links the beginning and ending values.
Should dividends be included in investment return?
Yes when calculating total return. Omitting dividends or interest can understate performance for income-producing investments.
Should investment fees be included in return calculations?
Yes when you want the investor result. Transaction costs, fund expenses, advisory fees, and other applicable costs can reduce net performance.
Can an investment have a positive yield but a negative total return?
Yes. Income can be positive while the investment price falls by a larger amount, producing a negative total return.
What is real investment return?
Real return adjusts nominal investment performance for inflation and, in broader usage, may also consider taxes. It focuses on growth in purchasing power rather than dollars alone.
What is the difference between return and yield?
Yield focuses on income relative to a value or price. Total return includes both income and changes in investment value.
How do contributions affect return calculations?
Deposits and withdrawals can distort a simple beginning-to-ending calculation. Time-weighted or money-weighted methods may be more appropriate when external cash flows are material.
What return should I compare with a benchmark?
Compare returns measured over the same period using compatible methods and a benchmark that reflects a similar asset class, market exposure, and risk profile.
Does a higher historical return mean an investment is better?
No. Historical return does not show the full picture of risk, volatility, costs, taxes, liquidity, concentration, or future performance.
Can I use a constant return to forecast future investment value?
You can use a constant return for a hypothetical planning illustration, but real returns fluctuate and the assumed rate is not a forecast or guarantee.
Why can my brokerage return differ from my own calculation?
The account may use different dates, cash-flow treatment, reinvestment assumptions, fee treatment, tax handling, or a time-weighted or money-weighted methodology.
Sources
These investor-education sources support the return formulas, performance interpretation, fee discussion, and real-return definitions on this page.
FINRA — Calculating Your Investment Returns
https://www.finra.org/investors/insights/investment-returns
Explains total return, investment cost, fees, dividends, negative returns, and annualized return calculations for comparing investment performance.
FINRA — Evaluating Performance
https://www.finra.org/investors/investing/investing-basics/evaluating-performance
Explains total return, annualized return, fees, taxes, inflation, benchmarking, and performance evaluation over time.
U.S. Securities and Exchange Commission — How Fees and Expenses Affect Your Investment Portfolio
https://www.sec.gov/file/ib_fees_expensespdf
Investor bulletin explaining how recurring and transaction costs can reduce investment portfolio value over long periods.
Investor.gov — Real Return
https://www.investor.gov/introduction-investing/investing-basics/glossary/real-return
Defines real return as investment return after accounting for inflation and taxes, distinguishing it from nominal return.