Finance & Money
Net Worth Chart
Net worth is the value of assets minus liabilities. A household with $750,000 of assets and $345,000 of debt has $405,000 of net worth. Income does not enter that equation directly because income is a flow over time, while net worth is a balance-sheet value at a specific date.
The latest detailed Federal Reserve Survey of Consumer Finances currently available reports $192,900 median family net worth in 2022 and $1,063,700 mean net worth. The Federal Reserve's 2022 SCF report shows large differences across age, housing status, income, and the wealth distribution.
Those 2022 figures remain the latest detailed SCF family benchmarks as of July 2026. The Federal Reserve said summary results from the 2025 SCF are expected in late 2026.
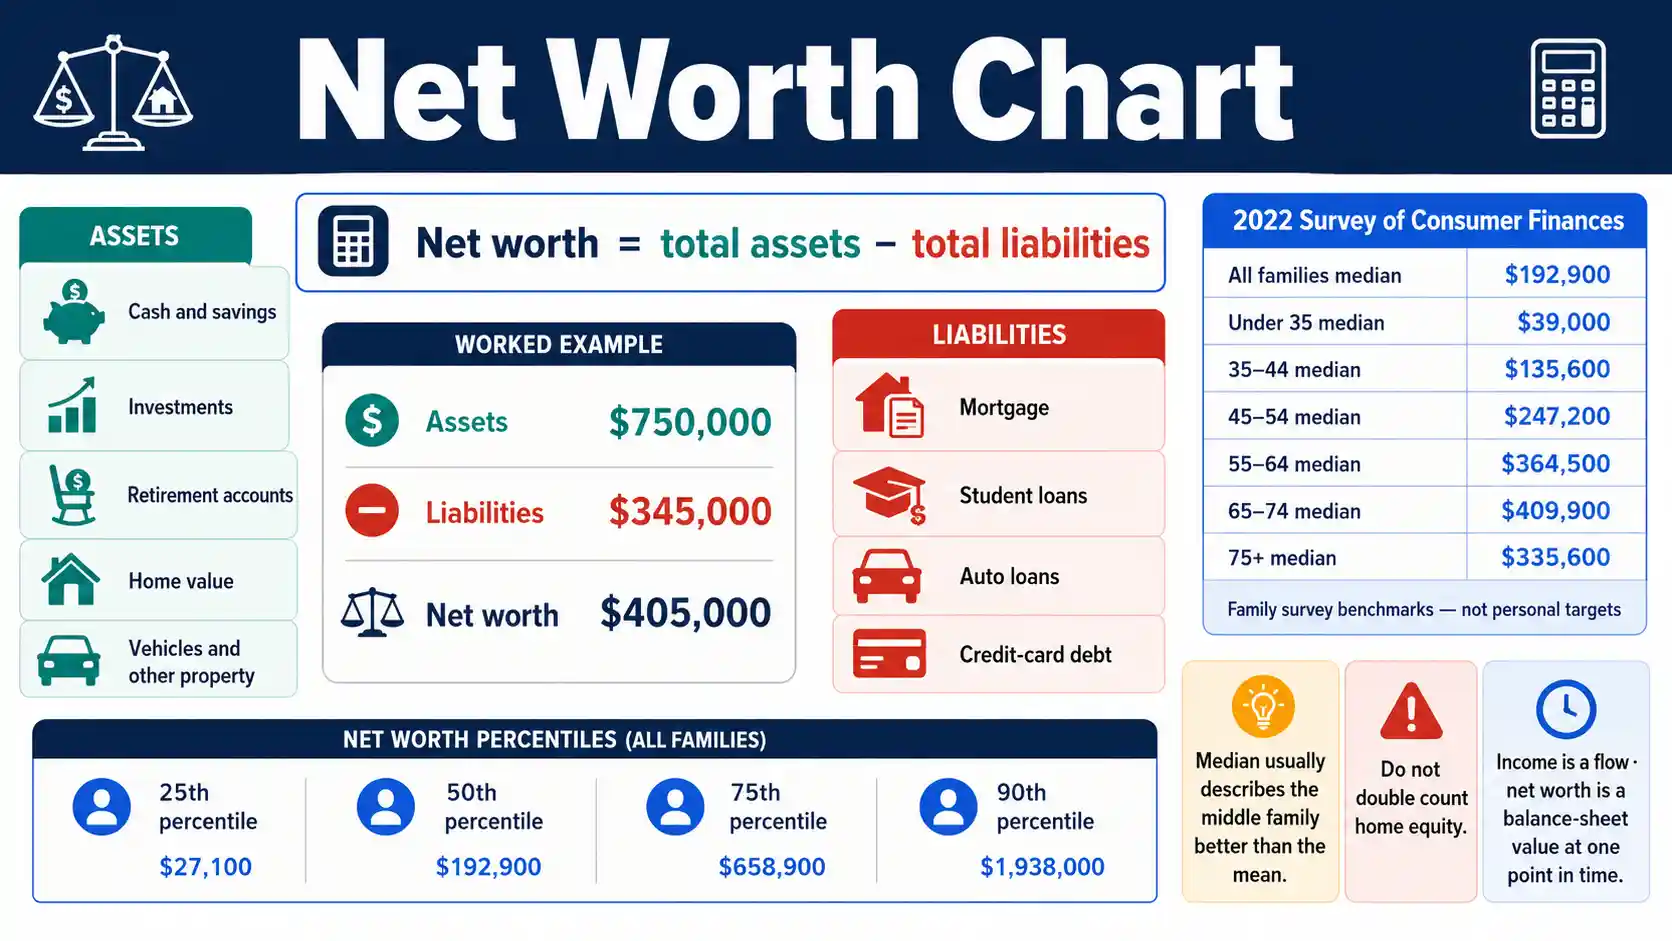
Core formula
Assets − liabilities
Net worth is a stock measure taken at a point in time, not a monthly income measure.
2022 median family
$192,900
Latest detailed SCF median currently available; amounts in the Federal Reserve table are 2022 dollars.
2022 mean family
$1,063,700
The mean is far above the median because high-wealth families pull the arithmetic average upward.
Homeowner median
$396,200
2022 SCF homeowner median; housing status is associated with wealth but is not a personal target or causal conclusion.
What a net worth number tells you
Net worth summarizes a balance sheet. It rises when assets increase faster than liabilities and falls when assets lose value or debt grows faster than assets.
A negative net worth is mathematically valid. It means liabilities exceed assets at the measurement date; it does not automatically mean a household cannot meet monthly bills.
Median net worth is usually a better description of the middle family than mean net worth because a relatively small number of very high wealth values can raise the average substantially.
Retirement accounts count as assets. A primary home also counts, but include the full home value and related mortgage separately rather than adding home equity twice.
Paying $1,000 of debt principal with $1,000 of existing cash is roughly net-worth neutral at that instant: one asset and one liability both fall by $1,000. Lower future interest costs can still improve later outcomes.
Net worth is not the same as liquidity or financial well-being. A household can have high home equity and still have limited emergency cash, or have modest net worth while maintaining strong cash flow and insurance protection.
Current U.S. wealth context is different from a household benchmark
The Federal Reserve's Financial Accounts reported aggregate net worth of households and nonprofit organizations at $183.0 trillion in the first quarter of 2026. That sector-wide total is useful for macroeconomic context, but it should not be divided by households and treated as a personal average because its definition, population, timing, and aggregation differ from the SCF family statistics above. Federal Reserve Financial Accounts provide the current aggregate measure.
Net Worth Formula and Worked Balance Sheet
Net worth equals total assets minus total liabilities. This illustrative balance sheet shows why the full asset value and the related debt should be recorded separately.
Swipe horizontally inside the table to view every column.
| Balance-sheet item | Classification | Illustrative value | How it affects net worth |
|---|---|---|---|
| Cash and savings | Asset | $20,000 | Adds $20,000 |
| Taxable investments | Asset | $60,000 | Adds $60,000 |
| Retirement accounts | Asset | $180,000 | Adds $180,000 |
| Home market value | Asset | $450,000 | Adds $450,000 |
| Vehicles and other property | Asset | $40,000 | Adds $40,000 |
| Mortgage balance | Liability | $300,000 | Subtracts $300,000 |
| Student loans | Liability | $25,000 | Subtracts $25,000 |
| Auto loan | Liability | $15,000 | Subtracts $15,000 |
| Credit cards | Liability | $5,000 | Subtracts $5,000 |
| Totals | Assets $750,000 · liabilities $345,000 | $405,000 net worth — Illustrative net worth result | Assets − liabilities |
Illustrative U.S. dollars. Use reasonable current values and current debt balances for your own calculation.
- • Do not add home equity as a separate asset if the full home value and mortgage balance are already included.
- • A positive asset value can fall while a liability can rise, so net worth can change even without new income.
Download or export
Median and Mean Net Worth by Age
Latest detailed Federal Reserve SCF benchmarks currently available. Age refers to the age of the family reference person, and amounts are in thousands of 2022 dollars.
Swipe horizontally inside the table to view every column.
| Age of reference person | 2022 median net worth | 2022 mean net worth | 2019–2022 median change |
|---|---|---|---|
| Under 35 | $39,000 | $183,500 | +143% |
| 35–44 | $135,600 | $549,600 | +28% |
| 45–54 | $247,200 | $975,800 | +27% |
| 55–64 | $364,500 | $1,566,900 | +48% |
| 65–74 | $409,900 — Highest median among age groups shown | $1,794,600 | +33% |
| 75 or older | $335,600 | $1,624,100 | +14% |
| All families | $192,900 | $1,063,700 | +37% |
2022 dollars. These are family-level survey statistics, not personal targets.
- • The mean is much higher than the median because wealth is unevenly distributed; median is often more representative of the middle family.
- • The 2025 SCF was completed, but the Federal Reserve said summary results would be published in late 2026.
Download or export
U.S. Family Net Worth Percentile Thresholds
Selected 2022 SCF percentile cutoffs show the net-worth level at which a family sits above the stated share of the measured family distribution.
Swipe horizontally inside the table to view every column.
| Percentile threshold | 2022 net worth | Interpretation | 2019 threshold |
|---|---|---|---|
| 25th percentile | $27,100 | About 25% of families were below this level and 75% above | $14,300 |
| 50th percentile | $192,900 — 2022 median net worth | Median: half below and half above | $141,100 |
| 75th percentile | $658,900 | About 75% below and 25% above | $468,100 |
| 90th percentile | $1,938,000 | About 90% below and 10% above | $1,414,500 |
2022 dollars. Percentile thresholds describe a survey distribution; they are not recommended savings goals.
- • Net worth can be negative, especially when liabilities exceed assets.
- • Age, housing status, business ownership, geography, household structure, and many other factors affect where a family falls in the distribution.
Download or export
Net Worth by Housing Status and Geography
2022 SCF medians and means illustrate how strongly housing status and geography are associated with measured family wealth. The figures do not prove that one status causes another.
Swipe horizontally inside the table to view every column.
| Family group | 2022 median net worth | 2022 mean net worth | Median change since 2019 |
|---|---|---|---|
| Homeowner | $396,200 — Homeowner median | $1,530,900 | +34% |
| Renter or other non-owner | $10,400 — Renter or other non-owner median | $154,900 | +43% |
| Metropolitan statistical area | $199,200 | $1,133,100 | +36% |
| Non-metropolitan area | $146,400 | $652,100 | +40% |
| All families | $192,900 | $1,063,700 | +37% |
Thousands converted to whole-dollar display; underlying SCF amounts are in 2022 dollars.
- • Home equity is often a major balance-sheet asset, but a home is illiquid and its market value can change.
- • Group statistics should not be used to judge whether a particular household is financially healthy.
Download or export
Browser-only balance-sheet tool
Household Net Worth Calculator
Enter aggregate asset values and debt balances. The calculator totals assets, subtracts liabilities, and also shows financial assets, estimated home equity, and debt as a share of assets.
Assets
Liabilities
Total assets
$800,000
Total liabilities
$310,000
Net worth
$490,000
Assets − liabilities.
Financial assets
$300,000
Cash + taxable investments + retirement accounts in this tool.
Home equity estimate
$175,000
Home value minus entered home debt. This can be negative.
Debt / assets
38.8%
A balance-sheet ratio, not a lender underwriting ratio or credit score.
Formula: net worth = total asset value − total liability balance.
Avoid double counting: if you enter the full home value and mortgage separately, do not also add home equity as another asset.
The calculation runs only in your browser. Do not enter account numbers, login credentials, or other sensitive financial identifiers.
Assets Commonly Included in Net Worth
Use reasonable current values for assets you own. The exact valuation method can vary by asset, so use a consistent approach when tracking changes over time.
Swipe horizontally inside the table to view every column.
| Asset category | Typical items | Useful value to record | Common mistake |
|---|---|---|---|
| Cash and transaction accounts | Checking, savings, money market cash | Current balance | Ignoring small accounts or double counting linked cash |
| Investments | Stocks, bonds, mutual funds, ETFs | Current market value | Using purchase cost instead of current value |
| Retirement assets | 401(k), 403(b), IRA and similar accounts | Current account value | Excluding retirement assets from total net worth |
| Primary residence | Owned home | Reasonable current market value | Counting full value and home equity separately — Avoid double counting home equity |
| Other real estate | Rental or second property | Reasonable current market value | Ignoring mortgages or other liens on the liability side |
| Vehicles and valuable property | Cars, boats and selected material property | Realistic resale value | Using original purchase price for depreciating assets |
| Business ownership and other assets | Closely held business interest and other material assets | Defensible estimate when available | Treating uncertain private-business estimates as exact cash value |
- • Net worth measures ownership value, not liquidity. A home or business can raise net worth while providing little immediately spendable cash.
- • Personal belongings with little resale value can be omitted for a simpler recurring tracker.
Download or export
Liabilities Commonly Subtracted From Net Worth
Use current principal or account balances rather than the sum of all future scheduled payments, which can include interest that has not yet accrued.
Swipe horizontally inside the table to view every column.
| Liability category | Typical examples | Value to record | Important note |
|---|---|---|---|
| Mortgage and home-secured debt | Primary mortgage, second mortgage, HELOC balance | Current outstanding principal/balance — Use current mortgage debt balance | Pair with the related property value on the asset side |
| Student debt | Federal and private student loans | Current outstanding balance | Income-based payment size is not the liability balance |
| Vehicle debt | Auto, motorcycle or boat loans | Current payoff or principal balance | Vehicle market value belongs separately on the asset side |
| Credit card debt | Revolving card balances | Current amount owed | A statement balance may differ from the live balance |
| Personal loans | Unsecured installment debt | Current principal/payoff balance | Do not subtract all future interest as current debt |
| Other material obligations | Tax debt, margin debt and other enforceable balances | Current amount owed | Treatment can depend on the obligation and valuation date |
- • A liability lowers net worth even when its monthly payment is small.
- • Paying principal generally increases net worth dollar-for-dollar if asset values and other balances do not change.
Download or export
How Common Financial Events Change Net Worth
These examples isolate one event at a time to show the accounting effect. Real households often experience several changes at once.
Swipe horizontally inside the table to view every column.
| Event | Asset change | Liability change | Approximate net-worth effect |
|---|---|---|---|
| Save $1,000 from existing income | +$1,000 cash | $0 | +$1,000 if spending does not rise elsewhere |
| Pay $1,000 of credit-card principal with cash | -$1,000 cash | -$1,000 debt | About $0 immediately; future interest cost may fall — Principal payoff alone is balance-sheet neutral immediately |
| Investment rises by $5,000 | +$5,000 investment value | $0 | +$5,000 before taxes or other changes |
| Home value falls by $20,000 | -$20,000 property value | $0 | -$20,000 before other changes |
| Borrow $10,000 and hold the cash | +$10,000 cash | +$10,000 debt | About $0 immediately before fees or interest |
| Buy a $30,000 car with $5,000 cash and $25,000 loan | +$30,000 vehicle · -$5,000 cash | +$25,000 debt | About $0 at purchase if vehicle is truly worth $30,000 |
| Vehicle later loses $4,000 of market value | -$4,000 vehicle value | $0 | -$4,000 before loan principal changes |
- • Debt payoff using existing cash changes the composition of the balance sheet but not net worth at the instant of principal payment.
- • Interest expense, taxes, transaction costs, depreciation, and market moves can change the longer-term result.
Download or export
Common net worth mistakes and important limits
Avoid double counting equity
If you record a $450,000 home and a $275,000 mortgage, the resulting $175,000 of home equity is already embedded in net worth. Do not add another $175,000 asset.
Use realistic current values
A car's purchase price, an investment's original cost, or an old home appraisal may not represent today's asset value. Consistency matters more than false precision.
Do not treat age medians as required targets
SCF age statistics describe groups with different incomes, family structures, housing histories, pensions, businesses, locations, and life events. Falling above or below a median does not diagnose financial health.
Net worth can hide liquidity risk
Home equity, retirement accounts, and private business interests may be valuable but difficult, costly, taxable, restricted, or slow to convert into spendable cash.
Estate values, trusts, pensions, private businesses, stock options, cryptocurrency, tax liabilities, contingent obligations, joint property, foreign assets, and closely held investments can require specialized valuation or legal and tax treatment. Use professional guidance when the balance sheet is complex or a valuation will be used for lending, divorce, estate planning, taxes, or another legal purpose.
Frequently asked questions
How do I calculate my net worth?
Add the current value of assets you own, add the balances of liabilities you owe, and subtract total liabilities from total assets.
What is the median U.S. family net worth?
The latest detailed Federal Reserve Survey of Consumer Finances currently available reports median family net worth of $192,900 in 2022 dollars for 2022.
What is the average U.S. family net worth?
The 2022 SCF reports mean family net worth of $1,063,700. The mean is far above the $192,900 median because wealth is unevenly distributed.
What is the median net worth for people under 35?
For families with a reference person younger than 35, the 2022 SCF median net worth was $39,000 and the mean was $183,500.
What is the median net worth for ages 35 to 44?
The 2022 SCF median for families with a reference person age 35 to 44 was $135,600.
What is the median net worth for ages 65 to 74?
The 2022 SCF median for families with a reference person age 65 to 74 was $409,900, the highest median among the age groups shown in that survey table.
Does a house count toward net worth?
Yes. Use a reasonable current home value as an asset and subtract the mortgage and other home-secured debt as liabilities.
Do retirement accounts count toward net worth?
Yes. Retirement accounts such as 401(k)s and IRAs are financial assets and are normally included in total net worth.
Does income count as net worth?
No. Income is a flow of money over a period, while net worth is a balance-sheet measure of assets minus liabilities at a point in time.
Can net worth be negative?
Yes. Net worth is negative when total liabilities exceed total assets.
Does paying off debt increase net worth?
Paying debt principal with existing cash is roughly net-worth neutral immediately because cash and debt both fall by the same amount. It can improve future net worth by reducing interest costs.
Should I use median or average net worth to compare myself?
Median is usually the better description of the middle family because very high wealth values pull the mean upward. Neither figure is a personal financial target.
How often should I update net worth?
Monthly, quarterly, or annually can all work. Use a consistent schedule and valuation method so changes reflect your finances rather than inconsistent measurement.
Is net worth the same as financial well-being?
No. Net worth is one balance-sheet metric. Cash flow, emergency savings, debt affordability, insurance, liquidity, goals, and financial security also matter.
Are the 2022 age benchmarks current?
They are the latest detailed SCF age benchmarks currently available. The Federal Reserve said summary results from the 2025 SCF would be published in late 2026.
Sources
Federal Reserve Board — Changes in U.S. Family Finances from 2019 to 2022
https://www.federalreserve.gov/publications/october-2023-changes-in-us-family-finances-from-2019-to-2022.htm
Defines family net worth as assets minus liabilities and provides 2022 median and mean net worth by age, housing status, income group, and net-worth percentile in 2022 dollars.
Federal Reserve Board — Survey of Consumer Finances Interactive Tables
https://www.federalreserve.gov/econres/scf/dataviz/scf/table/index.html
Provides downloadable SCF time-series data covering 1989 through 2022 and explains how asset, liability, income, and net-worth measures are constructed.
Federal Reserve Board — Federal Reserve Board Begins 2025 Survey of Consumer Finances
https://www.federalreserve.gov/newsevents/pressreleases/other20250228a.htm
States that the 2025 SCF was conducted through December 2025 and that summary results are expected in late 2026 after assessment and analysis.
Federal Reserve Board — Financial Accounts of the United States — First Quarter 2026
https://www.federalreserve.gov/releases/z1/current/recent_developments.htm
Reports that aggregate net worth of U.S. households and nonprofit organizations was $183.0 trillion in the first quarter of 2026.
Consumer Financial Protection Bureau — Why Financial Well-Being?
https://www.consumerfinance.gov/consumer-tools/financial-well-being/about/
Explains that financial well-being includes security and freedom of choice and cannot be captured by a single number such as income, net worth, or credit score.