Health & Medical · Laboratory tests
Normal Lab Values Chart for CBC, CMP, Thyroid, Iron and More
Compare common adult reference examples, units, panel components, report flags, specimen types, interpretation limits, and factors that can change a result.
Follow any critical-result call or urgent instruction from the laboratory or clinical team immediately. Seek emergency help for severe breathing difficulty, chest pain, stroke symptoms, seizure, unconsciousness, uncontrolled bleeding, or rapidly worsening illness. Read the ChartsLoom Disclaimer.
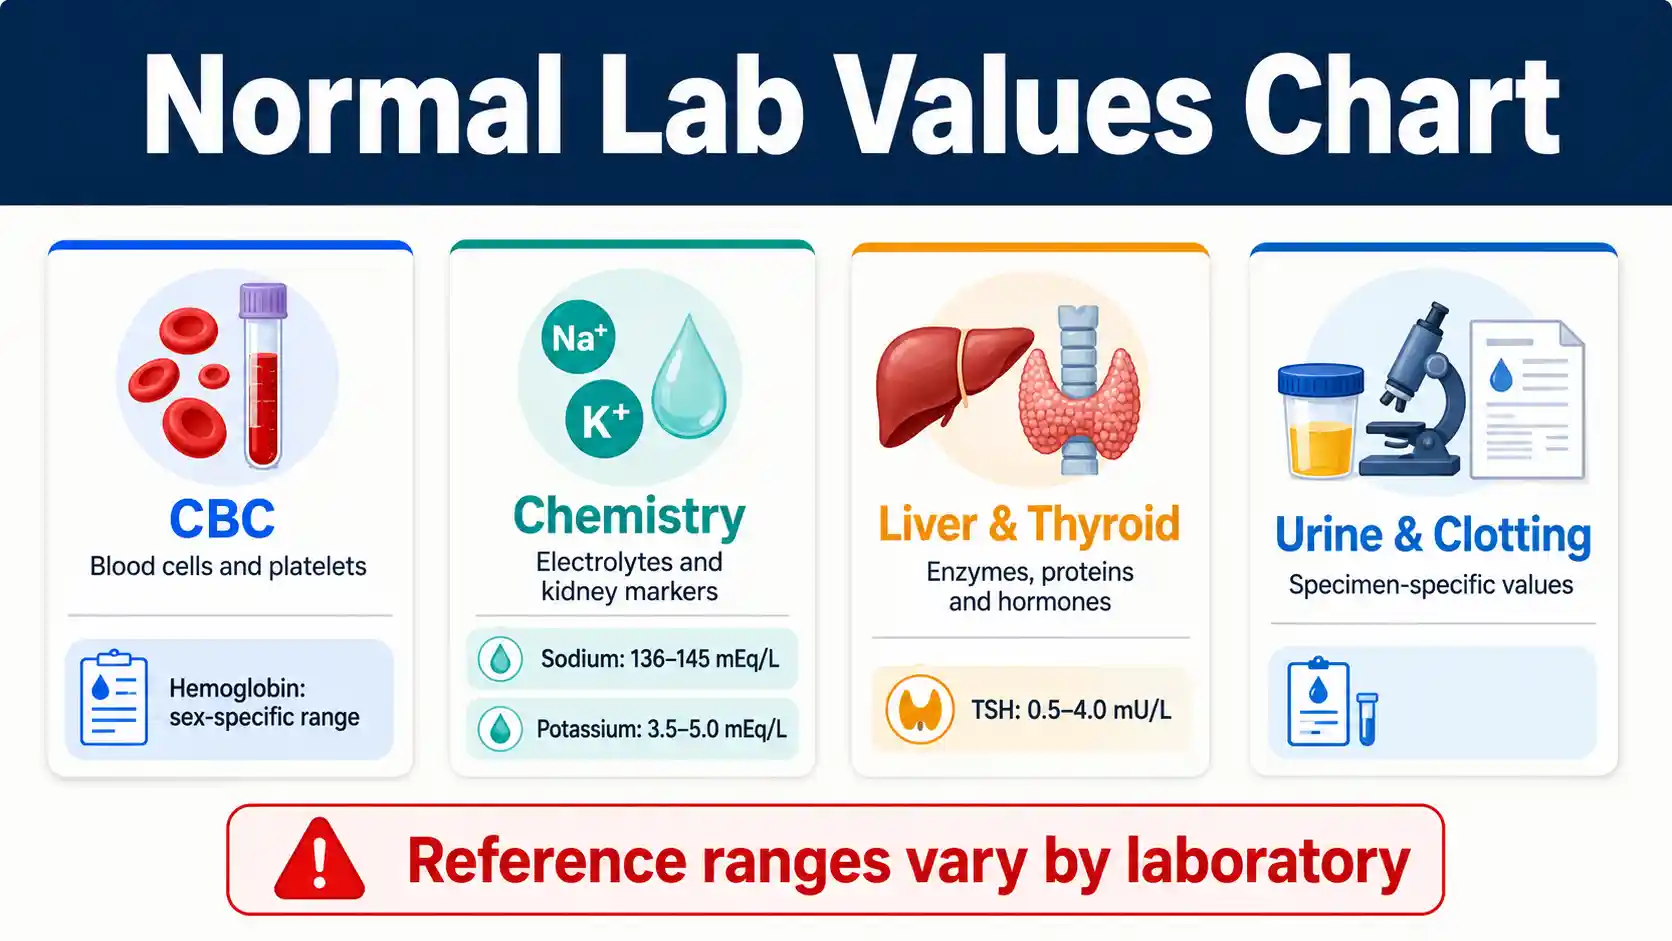
What are normal laboratory values?
Normal laboratory values are reference intervals expected in a defined healthy population. The interval on the performing laboratory's report takes priority because method, specimen, units, age, sex, pregnancy, and population can change it.
The ABIM laboratory reference table supplies the adult examples shown here. Use them to understand common units and magnitudes, not to replace the limits or clinical interpretation attached to your test.
CBC
Cells and platelets
Hemoglobin, hematocrit, cell counts, indices, and platelets form a related pattern.
Chemistry
Fluids and organs
Electrolytes, kidney markers, glucose, minerals, proteins, and enzymes use several units.
Best comparison
Your report range
Use the interval printed by the laboratory that performed the test.
Urgent flag
Follow the lab call
Critical-result policies are laboratory- and setting-specific.
Complete Blood Count Reference Ranges Chart
These are example adult blood reference intervals. Hemoglobin and hematocrit commonly use sex-specific ranges, while all CBC values can vary by laboratory and population.
Swipe horizontally inside the table to view every column.
| CBC test | Example adult reference interval | Unit | What the test describes |
|---|---|---|---|
| Red blood cell count (RBC) | 4.2–5.9 | million/µL | Number of circulating red blood cells |
| White blood cell count (WBC) | 4,000–11,000 | cells/µL | Total circulating white blood cells |
| Hemoglobin | Female: 12–16; male: 14–18 — Sex-specific hemoglobin reference examples | g/dL | Oxygen-carrying protein in red blood cells |
| Hematocrit | Female: 37–47; male: 42–50 — Sex-specific hematocrit reference examples | % | Percentage of blood volume made up of red blood cells |
| Mean corpuscular volume (MCV) | 80–98 | fL | Average red blood cell size |
| Mean corpuscular hemoglobin (MCH) | 28–32 | pg | Average hemoglobin amount per red blood cell |
| Mean corpuscular hemoglobin concentration (MCHC) | 33–36 | g/dL | Average hemoglobin concentration inside red blood cells |
| Red cell distribution width (RDW) | 9.0–14.5 | % | Variation in red blood cell size |
| Platelet count | 150,000–450,000 — Adult platelet reference example | platelets/µL | Number of platelets available for clot formation |
| Reticulocyte count | 0.5–1.5; absolute 25,000–100,000 | %; cells/µL | Young red blood cells released from bone marrow |
µL = microliter; g/dL = grams per deciliter; fL = femtoliter; pg = picogram.
- • Children, pregnancy, altitude, smoking, hydration, and laboratory method can require different CBC intervals.
- • A differential may report neutrophils, lymphocytes, monocytes, eosinophils, and basophils as percentages and absolute counts.
- • One abnormal cell count does not identify the cause; the related indices, smear, symptoms, and trend matter.
Download or export
Read a laboratory result in four checks
A number becomes meaningful only after the test name, specimen, units, applicable reference interval, health context, and surrounding results are identified.
Match the test
Confirm the analyte, specimen, method, units, fasting status, and collection time.
Use the report range
Compare the result with the interval printed by the laboratory that performed it.
Check your context
Age, sex, pregnancy, medicines, hydration, exercise, illness, and altitude can matter.
Review the pattern
Interpret related tests, symptoms, previous values, and any laboratory call together.
Do not compare unlike specimens or units, diagnose a condition from one flag, or ignore an urgent call from the laboratory or clinical team.
A reference interval is not a pass-or-fail health score
The MedlinePlus guide to lab results explains that healthy people can sometimes have an out-of-range result and people with a health problem can have an in-range result. Symptoms, history, related tests, and trends complete the picture.
Electrolyte, Kidney and Chemistry Reference Chart
Common serum or plasma chemistry tests assess fluid balance, acid-base status, kidney filtration markers, minerals, and glucose. Not every test appears in every panel.
Swipe horizontally inside the table to view every column.
| Chemistry test | Example adult reference interval | Unit | Interpretation context |
|---|---|---|---|
| Sodium | 136–145 — Adult sodium reference example | mEq/L | Water balance, nerves, and muscles |
| Potassium | 3.5–5.0 — Adult potassium reference example | mEq/L | Electrical activity in muscles and the heart |
| Chloride | 98–106 | mEq/L | Fluid and acid-base balance |
| Bicarbonate / total CO₂ | 23–28 | mEq/L | Acid-base balance; method and report label matter |
| Blood urea nitrogen (BUN) | 8–20 | mg/dL | Nitrogen waste influenced by kidney function, intake, hydration, and catabolism |
| Creatinine | Female: 0.50–1.10; male: 0.70–1.30 — Sex-specific creatinine reference examples | mg/dL | Muscle-derived waste used with age and sex to estimate filtration |
| Calcium, total | 8.6–10.2 | mg/dL | Total calcium; albumin and ionized calcium can change interpretation |
| Magnesium | 1.6–2.6 | mg/dL | Mineral important to nerves, muscles, and enzymes |
| Phosphorus | 3.0–4.5 | mg/dL | Mineral affected by kidneys, bone, hormones, and nutrition |
| Fasting plasma glucose | 70–99 — Fasting glucose reference example | mg/dL | Fasting glucose screening interval; diagnostic cutoffs use defined criteria |
mEq/L = milliequivalents per liter; mg/dL = milligrams per deciliter. SI-unit reports may use mmol/L or µmol/L.
- • A basic metabolic panel usually includes sodium, potassium, chloride, bicarbonate, BUN, creatinine, glucose, and calcium.
- • A comprehensive metabolic panel adds proteins, bilirubin, and liver-associated enzymes; panel names and included tests can vary.
- • Hemolysis can falsely raise potassium, and dehydration can concentrate several measured substances.
Download or export
Laboratory Range Checker
Compare a result with the range on your lab report
Enter the result, lower limit, and upper limit exactly as printed by the same laboratory. The checker only shows whether the number is below, within, or above that entered interval.
Use one report and one unit
Copy all three numbers from the same report. Do not combine a result from one method with limits from another source or convert units unless the laboratory provides the conversion.
This comparison is not a diagnosis or urgency check. A value inside an interval can still need follow-up, and a value outside it can have many explanations. Follow any critical-result message and ask the ordering clinician to interpret the full pattern.
Panels group related tests, but the pattern still needs context
A comprehensive metabolic panel combines electrolytes, glucose, kidney markers, proteins, bilirubin, and enzymes. One abnormal component may be isolated, temporary, or part of a broader pattern, so the collection conditions and neighboring results matter.
Liver, Protein and Enzyme Reference Ranges Chart
Liver-associated tests reflect different processes: cell injury, bile flow, protein production, or bilirubin handling. No single value measures every liver function.
Swipe horizontally inside the table to view every column.
| Test | Example adult reference interval | Unit | Main context |
|---|---|---|---|
| Alanine aminotransferase (ALT) | 10–40 | U/L | Enzyme associated with hepatocyte injury |
| Aspartate aminotransferase (AST) | 10–40 | U/L | Enzyme also found in muscle and other tissues |
| Alkaline phosphatase (ALP) | 30–120 | U/L | Bile-duct and bone-associated enzyme |
| Gamma-glutamyltransferase (GGT) | Female: 8–40; male: 9–50 — Sex-specific GGT reference examples | U/L | Enzyme that can help interpret an ALP pattern |
| Total bilirubin | 0.3–1.0 | mg/dL | Bilirubin from red-cell breakdown and liver processing |
| Direct bilirubin | 0.1–0.3 | mg/dL | Conjugated bilirubin |
| Albumin | 3.5–5.5 — Adult albumin reference example | g/dL | Major blood protein made by the liver |
| Total protein | 5.5–9.0 | g/dL | Albumin plus globulin proteins |
| Lactate dehydrogenase (LDH) | 80–225 | U/L | Nonspecific enzyme released with tissue injury |
| Lipase | 10–140 | U/L | Pancreatic digestive enzyme; assay ranges vary widely — Assay range varies |
U/L = units per liter; mg/dL = milligrams per deciliter; g/dL = grams per deciliter.
- • ALT, AST, ALP, and GGT intervals vary with assay, age, sex, body composition, and clinical population.
- • Albumin can fall for reasons outside the liver, including inflammation, kidney loss, and nutrition problems.
- • Interpret enzyme patterns and changes over time instead of treating one mild elevation as a diagnosis.
Download or export
Lipid and Glucose Screening Values Chart
Some familiar numbers are clinical decision categories rather than healthy-population reference intervals. These examples summarize common adult screening labels.
Swipe horizontally inside the table to view every column.
| Test | Common adult value or category | Unit | How to use it |
|---|---|---|---|
| Fasting plasma glucose | 70–99 — Fasting glucose reference example | mg/dL | ABIM reference example; diabetes screening uses defined diagnostic cutoffs |
| Hemoglobin A1C | 4.0–5.6 | % | ABIM reference example; 5.7% and higher enters clinical risk categories |
| Total cholesterol | Desirable: below 200 | mg/dL | Risk category rather than a universal normal interval |
| LDL cholesterol | Optimal: below 100 — Optimal LDL category | mg/dL | Personal treatment goals depend on cardiovascular risk |
| HDL cholesterol | Low: female below 50; male below 40 — Low HDL thresholds | mg/dL | A low threshold, not a complete risk assessment |
| Fasting triglycerides | Normal: below 150 | mg/dL | Meal timing, alcohol, metabolic health, and medicines can affect the result |
mg/dL = milligrams per deciliter. Glucose and lipid values may also be reported in mmol/L.
- • Reference intervals, screening cutoffs, risk categories, and treatment goals are not interchangeable.
- • Use the dedicated glucose or cholesterol chart for fuller diagnostic, target, and risk context.
- • Do not change diabetes or lipid medicine from one generic screening category.
Download or export
Thyroid, Iron and Vitamin Reference Ranges Chart
Hormone, iron, and vitamin tests depend strongly on assay, age, sex, pregnancy, supplements, inflammation, timing, and the clinical question.
Swipe horizontally inside the table to view every column.
| Test | Example adult reference interval | Unit | Important qualifier |
|---|---|---|---|
| Thyroid-stimulating hormone (TSH) | 0.5–4.0 — Adult TSH reference example | mU/L | Pregnancy, age, illness, medicines, and assay can change the interval |
| Free thyroxine (free T4) | 0.8–1.8 | ng/dL | Interpret with TSH and clinical context |
| Total triiodothyronine (total T3) | 80–180 | ng/dL | Binding proteins affect total hormone values |
| Ferritin | Female: 24–307; male: 24–336 — Sex-specific ferritin reference examples | ng/mL | Also rises with inflammation; a normal value may not answer every iron question |
| Serum iron | 50–150 | µg/dL | Varies by timing, intake, inflammation, and collection conditions |
| Total iron-binding capacity (TIBC) | 250–310 | µg/dL | Used with iron to assess binding capacity |
| Transferrin saturation | 20–50 | % | Calculated from serum iron and binding capacity |
| Vitamin B12 | 200–800 | pg/mL | Borderline values may need clinical or metabolic follow-up |
| Serum folate | 1.8–9.0 | ng/mL | Diet, supplements, and assay affect the result |
| 25-hydroxyvitamin D | 30–60 | ng/mL | An ABIM reference example; clinical targets and assay ranges can differ — Reference example, not a universal treatment target |
mU/L = milliunits per liter; ng = nanogram; µg = microgram; pg = picogram.
- • Use pregnancy-specific thyroid intervals when pregnant; nonpregnant adult examples should not be substituted.
- • Ferritin, serum iron, TIBC, transferrin saturation, CBC indices, symptoms, and inflammation often need joint interpretation.
- • Do not start or increase a supplement solely because a generic chart and one result appear different.
Download or export
Children and pregnancy need their own reference intervals
Developing children can have markedly different blood counts, enzymes, minerals, and hormones. Pregnancy changes plasma volume, filtration, proteins, glucose regulation, and thyroid physiology. Use the age-, sex-, pregnancy-, or trimester-specific interval supplied with the result.
Clotting and Inflammation Reference Ranges Chart
Coagulation and inflammation tests are method-sensitive. Anticoagulant use, acute illness, age, sex, pregnancy, and assay calibration can substantially change interpretation.
Swipe horizontally inside the table to view every column.
| Test | Example adult reference interval | Unit | Interpretation note |
|---|---|---|---|
| Prothrombin time (PT) | 11–13 | seconds | Assesses part of the clotting pathway; reagent affects the result |
| Activated partial thromboplastin time (aPTT) | 25–35 | seconds | Assesses another part of the clotting pathway |
| Fibrinogen | 200–400 | mg/dL | Clotting protein that can also rise with inflammation |
| D-dimer | Below 0.5 | µg/mL | Assay and reporting units vary; clinical algorithms may use adjusted cutoffs — Assay and unit dependent |
| Erythrocyte sedimentation rate (ESR) | Female: 0–20; male: 0–15 — Sex-specific ESR reference examples | mm/hr | Nonspecific marker affected by age, anemia, pregnancy, and other factors |
| C-reactive protein (CRP) | 0.8 or below | mg/dL | General inflammation marker; not the same as cardiovascular hs-CRP categories |
| Serum or plasma lactate | 0.7–2.1 | mmol/L | Specimen type, collection, transport, and illness severity matter — Specimen handling matters |
PT and aPTT are reported in seconds; D-dimer units and cutoffs must be taken from the performing laboratory.
- • Therapeutic anticoagulation uses treatment-specific targets, not the untreated reference examples in this chart.
- • An elevated ESR or CRP shows inflammation may be present but does not identify its location or cause.
- • Follow any urgent laboratory communication even when a generic online interval appears different.
Download or export
Common Urine Reference Values Chart
Urine interpretation depends on whether the sample is random, first-morning, timed, or collected over 24 hours. Concentration and contamination also matter.
Swipe horizontally inside the table to view every column.
| Urine test | Example reference value | Unit or format | Collection context |
|---|---|---|---|
| Specific gravity | 1.002–1.030 | ratio | Reflects urine concentration; hydration and kidney concentrating ability matter |
| pH | 4.5–8.0 | pH units | Diet, medicines, infection, storage, and metabolism can affect pH |
| Albumin, 24-hour urine | Below 25 | mg/24 hr | Requires a complete timed collection |
| Albumin-to-creatinine ratio (UACR) | Below 30 — Urine albumin-to-creatinine reference example | mg/g | Spot urine ratio that adjusts partly for concentration |
| Total protein, 24-hour urine | Below 100 — Timed urine protein reference example | mg/24 hr | Collection completeness is essential |
| Protein-to-creatinine ratio | Below 0.2 — Spot urine protein ratio reference example | mg/mg | Spot ratio used instead of a timed protein collection in some settings |
A timed collection is not interchangeable with a random concentration. Confirm the sample type on the report.
- • Menstruation, exercise, fever, infection, hydration, and sample contamination can affect urine results.
- • Dipstick protein, albumin, total protein, and protein-to-creatinine ratios are related but not identical measurements.
- • A persistent abnormal urine result often needs confirmation with the method selected by the clinician.
Download or export
Lab Result Flags and Report Terms Chart
Laboratory reports use flags and interpretive terms to direct attention. A flag describes the relationship to a rule or interval; it does not supply a diagnosis by itself.
Swipe horizontally inside the table to view every column.
| Report term | What it usually means | What to check next | Common mistake to avoid |
|---|---|---|---|
| H or high | Result is above the laboratory comparison limit | Units, applicable population, symptoms, related tests, and trend | Assuming every high flag is dangerous |
| L or low | Result is below the laboratory comparison limit | Units, applicable population, symptoms, related tests, and trend | Assuming a small low flag proves deficiency |
| Critical / panic value | Result meets the laboratory threshold for urgent communication — Urgent laboratory communication | Follow the call or message immediately and verify the clinical plan | Substituting a generic web range for the laboratory instruction |
| Positive / detected | The target was found according to the test rule | Test purpose, confirmation needs, false-positive risk, and symptoms | Treating every positive result as a final diagnosis |
| Negative / not detected | The target was not found according to the test rule | Timing, sensitivity, specimen quality, and ongoing symptoms | Assuming a negative result excludes every possibility |
| Reference interval | Values expected in a defined healthy reference population — Reference interval definition | The interval printed on the report | Calling the interval a guarantee of health |
| Decision threshold | A cutoff tied to screening, diagnosis, risk, or treatment guidance | The exact guideline, method, and patient context | Confusing a clinical cutoff with a healthy-population interval |
| Delta check / significant change | Current result differs meaningfully from a prior result — Important change from prior result | Timing, same-lab comparability, specimen issues, and clinical change | Ignoring a large change because both values are in range |
Flags, reference intervals, clinical decision limits, therapeutic targets, and critical values are different concepts.
- • A healthy person can have a value outside a statistical interval, and a person with disease can have a value inside it.
- • A panel creates a pattern; the relationship between results can be more informative than one isolated flag.
- • Critical-result policies are set by laboratories and clinical settings rather than one universal online chart.
Download or export
A critical result is different from an ordinary high or low flag
Laboratories set critical-value thresholds for urgent communication. The exact number can depend on the analyte, method, patient group, and clinical setting. Follow the laboratory or clinician's instruction instead of trying to overrule it with a generic interval.
Factors That Change Lab Values Chart
Pre-analytic, biologic, analytic, and clinical factors can shift a result or change the interval that applies. Record the conditions around an unexpected test.
Swipe horizontally inside the table to view every column.
| Factor | How it can matter | Examples | Practical check |
|---|---|---|---|
| Age and development | Normal physiology changes from infancy through older adulthood | Blood counts, creatinine, ALP, hormones | Use an age-specific interval |
| Sex and reproductive stage | Reference populations and physiology can differ | Hemoglobin, hematocrit, creatinine, ferritin, hormones | Use the interval printed for the applicable group |
| Pregnancy | Plasma volume, kidney filtration, hormones, and proteins change | CBC, creatinine, thyroid tests, ALP, glucose — Pregnancy changes common laboratory values | Use pregnancy- and trimester-specific guidance |
| Food and fasting | Meals can change concentration or test interpretation | Glucose, triglycerides, iron | Follow the preparation instructions and record fasting duration |
| Time, posture, and activity | Circadian rhythm, standing, and exercise can shift values | Cortisol, hormones, CK, lactate | Note collection time and unusual activity |
| Hydration and fluid loss | Concentration or dilution changes many results | Hemoglobin, hematocrit, sodium, BUN, urine specific gravity | Consider vomiting, diarrhea, fluid intake, and IV fluids |
| Medicines and supplements | Can alter physiology or interfere with an assay | Thyroid tests, electrolytes, liver enzymes, coagulation tests | Share all prescribed, over-the-counter, and supplement use |
| Specimen and handling | Hemolysis, contamination, delay, or wrong tube can distort a result — Specimen problems can distort results | Potassium, glucose, lactate, coagulation | Check report comments and whether recollection is advised |
| Laboratory and method | Instruments, calibration, reagents, and populations differ | Most quantitative tests | Compare with that laboratory’s interval and use the same lab for trends when practical — Use the performing laboratory interval |
| Acute illness and inflammation | Temporary physiologic responses can shift multiple markers | WBC, ferritin, albumin, CRP, glucose | Interpret the pattern with symptoms and timing |
Pre-analytic = before analysis; analytic = during measurement; post-analytic = reporting and interpretation.
- • Do not stop a prescribed medicine before testing unless the ordering clinician or laboratory instructs you to do so.
- • A repeat result may be needed when preparation, collection, transport, or assay interference is suspected.
- • For trends, compare the same analyte, specimen, method, units, and laboratory whenever possible.
Download or export
Frequently asked questions
What are normal lab values?
Normal lab values are usually reference intervals derived from results in a defined group of healthy people. They are not universal guarantees of health, and the interval printed by the laboratory that performed the test is the correct comparison for that result.
Why do normal lab ranges vary between laboratories?
Laboratories can use different instruments, reagents, calibration, methods, specimens, and reference populations. Each laboratory establishes or validates intervals for its testing system, so the limits can differ even when the test name looks identical.
Does an H or L flag mean I have a disease?
No. H means above and L means below the laboratory comparison interval. A flag needs interpretation with the size of the change, symptoms, related results, previous values, medicines, preparation, specimen quality, and health history.
Can a result be in range when a health problem is present?
Yes. Reference intervals usually describe a statistical distribution in a healthy group, not a perfect disease screen. Some conditions can be present with an in-range result, especially early or when that test is not sensitive to the problem.
Is a result slightly outside the range always concerning?
Not necessarily. Healthy people sometimes fall just outside a reference interval, and normal biological or measurement variation can cause a small flag. The result still deserves context, especially if symptoms, repeated changes, or related abnormalities are present.
Can I compare results that use different units?
Only after using a valid analyte-specific conversion and confirming the same specimen and method. Do not compare a numerical result with a range in another unit simply because the numbers look similar.
What is included in a CBC?
A complete blood count typically reports red blood cells, hemoglobin, hematocrit, red-cell indices, white blood cells, and platelets. Many reports also include a white-cell differential and other calculated indices.
What is included in a BMP or CMP?
A basic metabolic panel commonly measures glucose, calcium, sodium, potassium, bicarbonate, chloride, BUN, and creatinine. A comprehensive metabolic panel usually adds albumin, total protein, bilirubin, ALP, ALT, and AST.
Do all blood tests require fasting?
No. Fasting requirements depend on the ordered tests and the laboratory protocol. Follow the exact instructions from the ordering clinician or laboratory, and do not fast longer than directed.
Can adults use these ranges for children?
No. Children need age- and developmental-stage reference intervals, and some values change rapidly during infancy, childhood, and puberty. Use the pediatric interval printed on the child’s report.
Do normal lab values change during pregnancy?
Yes. Pregnancy changes blood volume, kidney filtration, hormones, proteins, enzymes, and glucose regulation. Many tests need pregnancy- or trimester-specific interpretation.
What is a critical or panic laboratory value?
It is a result that meets the performing laboratory’s threshold for urgent communication because delay could be dangerous. Thresholds vary by test and setting. Follow the laboratory or clinical team’s instructions immediately.
When should I contact a clinician about a lab result?
Contact the ordering clinician when a result is flagged, unexpected, changing, associated with symptoms, or not explained in the report. Respond promptly to any critical-result call, portal alert, or explicit urgent instruction.
Can medicines or supplements affect laboratory results?
Yes. Prescribed medicines, over-the-counter products, vitamins, minerals, herbs, and biotin can alter physiology or interfere with assays. Share the complete list, but do not stop a medicine unless instructed.
Why is using the same laboratory useful for trends?
The same laboratory is more likely to use consistent methods, units, and reference intervals. This reduces avoidable variation when a clinician is tracking whether a result is rising, falling, or stable over time.
Sources
These laboratory reference and patient-education resources support the adult examples, panel descriptions, variation factors, report terms, and interpretation guidance.
American Board of Internal Medicine — Laboratory Tests Reference Ranges
https://www.abim.org/Media/bfijryql/laboratory-reference-ranges.pdf
Provides the adult reference examples used across the CBC, chemistry, liver, thyroid, iron, coagulation, inflammation, and urine tables.
Merck Manual Professional Edition — Laboratory Reference Ranges
https://www.merckmanuals.com/professional/resources/normal-laboratory-values/laboratory-reference-ranges
Explains how laboratories establish or validate reference intervals and why age, sex, geography, specimen, method, and other factors change them.
MedlinePlus — How to Understand Your Lab Results
https://medlineplus.gov/lab-tests/how-to-understand-your-lab-results/
Explains reference ranges, units, positive and negative results, false results, preparation, and why the laboratory report is the correct comparison source.
MedlinePlus Medical Encyclopedia — Comprehensive Metabolic Panel
https://medlineplus.gov/ency/article/003468.htm
Lists common CMP components and example ranges while emphasizing that laboratories, measurements, specimens, and patient factors can differ.
MedlinePlus — Complete Blood Count
https://medlineplus.gov/lab-tests/complete-blood-count-cbc/
Describes the blood-cell measures in a CBC and factors that can produce abnormal results without establishing one diagnosis.