Finance & Money
Retirement Savings Chart
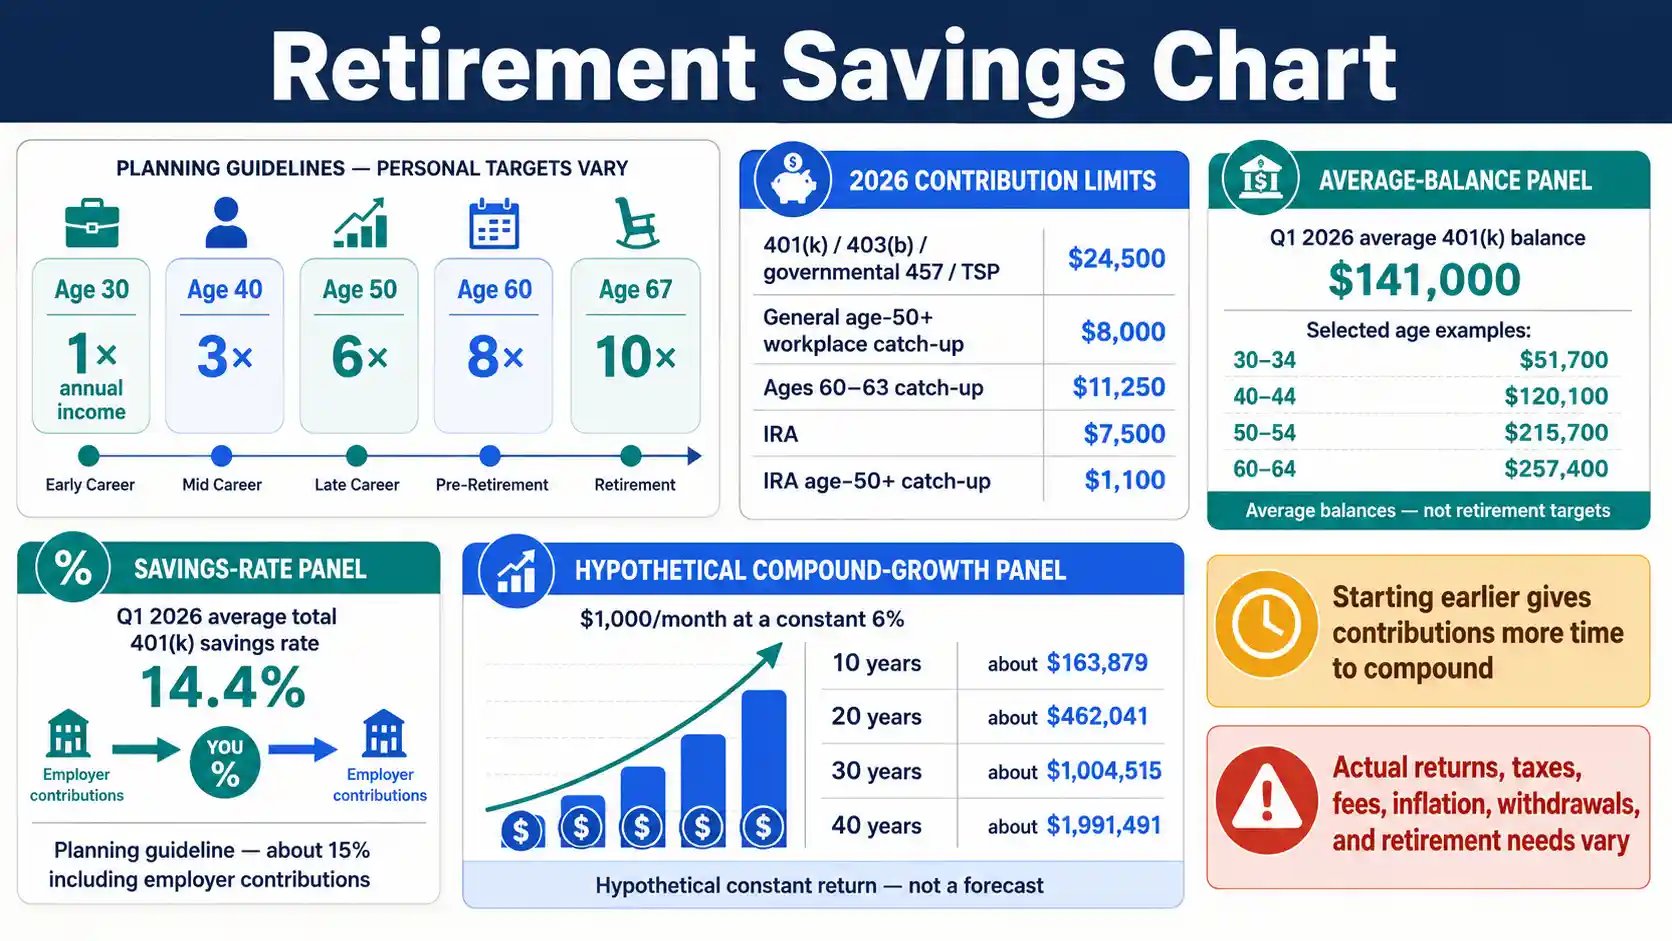
Retirement savings targets depend on income, retirement age, future spending, Social Security, pensions, taxes, health care, and investment results. One widely used Fidelity guideline suggests aiming for 1× annual income by age 30, 3× by 40, 6× by 50, 8× by 60, and 10× by 67 under its stated assumptions.
Those multiples are planning checkpoints rather than legal limits or guaranteed retirement requirements. Fidelity's framework assumes, among other factors, a roughly 15% combined savings rate, retirement at age 67, and a long investing horizon. Fidelity explains the assumptions behind its retirement guidelines.
For 2026, the IRS raised the employee elective-deferral limit for most 401(k), 403(b), governmental 457 plans, and the federal TSP to $24,500. The IRA contribution limit increased to $7,500. IRS guidance lists the current contribution and catch-up limits.
Age 30 guideline
1× income
Fidelity milestone under assumptions that include long-term saving and retirement at age 67.
Age 67 guideline
10× income
A planning benchmark, not a guaranteed retirement-ready balance.
2026 workplace limit
$24,500
Employee elective-deferral limit for most 401(k), 403(b), governmental 457 plans, and TSP.
2026 IRA limit
$7,500
Combined traditional and Roth IRA annual contribution limit, subject to compensation and eligibility rules.
What retirement savings benchmarks can and cannot tell you
A salary multiple compares retirement assets with current income. It does not directly calculate future retirement spending, taxes, Social Security benefits, pensions, or health-care costs.
The average 401(k) balance is not a retirement target. Someone may have an old 401(k), IRA, pension, brokerage account, spouse's plan, or other assets outside the current workplace account.
Starting earlier gives contributions more time to compound. A later starter can still improve the outlook by raising the savings rate, using eligible catch-up contributions, delaying retirement, reducing future spending, or combining several adjustments.
An employer match counts toward a combined savings rate, but the employee elective-deferral limit and the plan's employer-contribution rules still apply separately.
Retirement savings and net worth are different. A home can materially raise household net worth while providing little liquid retirement income unless the homeowner plans to sell, borrow against, or otherwise use that equity.
A constant return is useful for scenario math, not prediction. Real investment returns vary and can be negative, especially over shorter periods.
Retirement-account limits can change each tax year, and IRA deductions or Roth IRA contribution eligibility can depend on income and workplace-plan coverage. Verify the current IRS rules and your own plan documents before making a contribution decision.
Retirement Savings Milestones by Age
Fidelity age-based salary multiples are planning guidelines, not minimum balances or guarantees. They assume a long saving horizon, a 15% combined savings rate, retirement at age 67, and other stated assumptions.
Swipe horizontally inside the table to view every column.
| Age | Suggested savings multiple | Example at $80,000 salary | Interpretation |
|---|---|---|---|
| 30 | 1× annual income | $80,000 | Starting milestone under the guideline assumptions |
| 40 | 3× annual income | $240,000 | Mid-career checkpoint |
| 50 | 6× annual income | $480,000 | Later-career checkpoint |
| 60 | 8× annual income | $640,000 | Approaching retirement checkpoint |
| 67 | 10× annual income — 10× guideline at age 67 | $800,000 | Retirement-age guideline under the stated assumptions |
Illustrative salary-multiple framework. Your retirement age, pension, Social Security, spending, taxes, health care, savings rate, and investment returns can materially change the required amount.
- • The example uses a constant $80,000 salary only to translate the multiplier into dollars.
- • A lower balance than a guideline does not mean retirement is impossible, and a higher balance does not guarantee retirement readiness.
Download or export
Average 401(k) Balance by Age
Fidelity workplace-plan averages as of March 31, 2026. These averages describe participating accounts in the underlying dataset; they are not recommended balances.
Swipe horizontally inside the table to view every column.
| Age | Average 401(k) balance | Age | Average 401(k) balance |
|---|---|---|---|
| 20–24 | $7,700 | 45–49 | $163,200 |
| 25–29 | $26,600 | 50–54 | $215,700 |
| 30–34 | $51,700 — Average 401(k) balance for ages 30–34 | 55–59 | $260,800 |
| 35–39 | $81,600 | 60–64 | $257,400 |
| 40–44 | $120,100 | 65–69 | $258,800 |
| 70+ | $264,500 | All 401(k) accounts | $141,000 overall Q1 2026 average |
Account balances in U.S. dollars. Age averages reflect Fidelity 401(k) data and should not be treated as a full household retirement-balance measure.
- • A person may have multiple retirement accounts, pensions, taxable investments, or savings outside a current 401(k).
- • Average values can be pulled upward by high balances and are different from age-based planning milestones.
Download or export
2026 Retirement Contribution Limits
IRS limits vary by account and contribution type. Eligibility, compensation, income phase-outs, employer plan terms, and tax treatment can further restrict what a person may contribute or deduct.
Swipe horizontally inside the table to view every column.
| Account or limit | 2026 base limit | Catch-up / higher limit | Important qualification |
|---|---|---|---|
| 401(k), 403(b), governmental 457 and TSP employee deferral | $24,500 — 2026 workplace elective-deferral limit | $8,000 generally age 50+; $11,250 ages 60–63 | Employee elective-deferral limit; plan and compensation rules apply |
| Traditional + Roth IRA combined | $7,500 — 2026 IRA contribution limit | $1,100 age 50+ | Combined annual IRA contribution limit; Roth eligibility and traditional deduction rules can depend on income |
| Overall defined-contribution annual additions | $72,000 | Up to $80,000 with general catch-up or $83,250 with age 60–63 catch-up | Generally lesser of 100% of compensation or the annual dollar limit; catch-up treatment differs |
| SIMPLE IRA employee contribution | $17,000 | $4,000 general catch-up; $5,250 ages 60–63 | Certain applicable SIMPLE plans can use a higher base limit |
| Certain applicable SIMPLE plans | $18,100 | Special catch-up rules can differ | Check the plan and current IRS rules before contributing |
Tax year 2026 limits.
- • The 401(k)/403(b)/457/TSP employee deferral limit increased to $24,500 for 2026.
- • The IRA limit increased to $7,500 and the IRA age-50 catch-up increased to $1,100.
Download or export
Retirement Savings Rate Comparison
This table converts a retirement savings rate into annual dollars for an $80,000 salary. Employer contributions are included only in the rows that say combined savings.
Swipe horizontally inside the table to view every column.
| Savings rate | Annual amount on $80,000 pay | Monthly equivalent | Context |
|---|---|---|---|
| 5% | $4,000 | $333.33 | Example employee contribution rate |
| 10% | $8,000 | $666.67 | Example employee contribution rate |
| 12% | $9,600 | $800.00 | Example employee contribution rate |
| 14.4% — Q1 2026 average total 401(k) savings rate | $11,520 | $960.00 | Q1 2026 average total 401(k) savings rate in Fidelity data |
| 15% — 15% guideline | $12,000 | $1,000.00 | Fidelity suggested combined savings rate under its guideline assumptions |
| 20% | $16,000 | $1,333.33 | Illustrative higher combined savings rate |
Percentage of annual pay. A combined savings rate can include employer contributions.
- • A percentage target is not a substitute for a full retirement-income plan.
- • Saving more earlier can reduce the amount of catch-up saving needed later, but investment returns are uncertain.
Download or export
Monthly Retirement Saving Growth Examples
Hypothetical examples assume monthly contributions at the end of each month and a constant 6% nominal annual return compounded monthly. Returns are not guaranteed.
Swipe horizontally inside the table to view every column.
| Monthly contribution | 10 years | 20 years | 30 years | 40 years |
|---|---|---|---|---|
| $250 | $40,970 | $115,510 | $251,129 | $497,873 |
| $500 | $81,940 | $231,020 | $502,258 | $995,745 |
| $750 | $122,910 | $346,531 | $753,386 | $1,493,618 |
| $1,000 | $163,879 | $462,041 | $1,004,515 — $1,000 monthly for 30 years at hypothetical 6% | $1,991,491 |
| $1,500 | $245,819 | $693,061 | $1,506,773 | $2,987,236 |
Future value in nominal U.S. dollars; no starting balance, taxes, fees, or inflation adjustment.
- • The table illustrates compounding, not expected market performance.
- • Actual retirement-account values can be higher or lower because returns vary and fees, taxes, contribution timing, and withdrawals matter.
Download or export
Browser-only educational tool
Retirement Savings Growth Calculator
Model a starting retirement balance plus employee and employer contributions under a constant annual-return assumption. The result is a scenario, not a forecast.
Modeled ending balance
$1,941,611
Constant 6.0% annual return, compounded monthly.
Total starting + contributions
$580,000
Starting balance plus employee and employer contributions over 30 years.
Modeled investment growth
$1,361,611
Ending value minus starting balance and modeled contributions.
Combined annual saving
$16,000
75% employee · 25% employer in this scenario.
Model: current savings grow monthly, and the combined annual employee and employer contribution is divided into equal end-of-month deposits.
Not included: salary growth, contribution-limit changes, taxes, fees, withdrawals, Roth conversions, Social Security, pensions, inflation, changing returns, or sequence-of-returns risk.
The calculation runs only in your browser. No account balance, salary, contribution, or other entry is transmitted or stored.
Common Retirement Saving Accounts
Account rules differ. This table summarizes broad planning distinctions and does not replace plan documents or current tax guidance.
Swipe horizontally inside the table to view every column.
| Account | Who commonly uses it | Contribution source | Key planning distinction |
|---|---|---|---|
| 401(k) / 403(b) | Employees with an eligible workplace plan | Employee deferral + possible employer contributions — Potential employer contribution | Higher contribution limit than an IRA; investment menu and match depend on plan |
| Governmental 457(b) | Eligible state and local government employees | Employee deferral + possible employer contributions | Separate plan rules; 457 deferrals can interact differently with other plans |
| Traditional IRA | Eligible individuals with compensation | Individual contributions | Tax deduction can phase out when workplace-plan coverage and income rules apply |
| Roth IRA | Eligible individuals with compensation | After-tax individual contributions | Direct contribution eligibility phases out at higher incomes |
| SIMPLE IRA | Employees of participating smaller employers | Employee + required employer contribution structure | Different contribution and catch-up limits from 401(k) plans |
| Taxable brokerage account | Anyone eligible to open the account | After-tax deposits | No retirement contribution limit, but no IRA/401(k)-style tax shelter and investment income may be taxable |
- • Employer match formulas, vesting, investment options, withdrawal rules, loan features, and fees vary by plan.
- • The best account order depends on plan quality, employer match, tax situation, liquidity needs, debt, and other goals.
Download or export
Factors That Change a Retirement Savings Goal
A retirement target cannot be reduced to age alone. These variables can raise or lower the portfolio amount and annual saving needed.
Swipe horizontally inside the table to view every column.
| Planning factor | Why it matters | Can increase required savings? | Can reduce required savings? |
|---|---|---|---|
| Retirement age | Changes the saving period and number of retirement years to fund — Retirement age changes both saving and spending horizons | Earlier retirement often does | Later retirement often can |
| Retirement spending | Determines how much annual cash flow the plan must support | Higher spending does | Lower spending can |
| Social Security / pension income | Can cover part of retirement spending | Lower guaranteed income can | Higher reliable income can |
| Investment returns | Affect growth before and during retirement | Lower returns can | Higher realized returns can, but cannot be guaranteed |
| Inflation | Raises future cost of goods and services | Higher inflation can | Lower inflation can |
| Health care and long-term care | Can create large and uncertain future costs | Higher costs can | Other coverage or lower costs may |
| Taxes and account type | A dollar in a pre-tax account may have different spendable value from a Roth or taxable dollar | Higher tax burden can | Lower tax burden can |
| Fees | Reduce the amount left invested and compounding | Higher fees can | Lower fees can |
- • Retirement planning is a cash-flow problem as well as a savings-balance problem.
- • Revisit assumptions periodically because income, family circumstances, markets, taxes, laws, and spending expectations change.
Download or export
Common retirement savings mistakes and special cases
Do not compare unlike account balances
A current 401(k) may represent only one slice of retirement wealth. Combine relevant retirement accounts before judging progress against a personal target.
Do not ignore employer match rules
Match formulas and vesting vary. A stated match is not automatically yours in full if the contribution formula, service requirement, or vesting schedule is not satisfied.
Do not treat assumed returns as guaranteed
A 6% or 8% compound-growth example creates a smooth line that real markets do not follow. Actual outcomes depend on return sequence, fees, taxes, contributions, and withdrawals.
Tax treatment changes spendable value
Traditional, Roth, taxable, pension, and HSA dollars can have different tax consequences. Equal account balances do not always translate into equal retirement spending power.
Self-employed plans, pensions, after-tax 401(k) contributions, Roth conversions, inherited accounts, required minimum distributions, health savings accounts, nonqualified deferred compensation, divorce orders, and multiple-employer plans can require additional rules beyond this chart. Contribution limits also interact with compensation, income, employer contributions, and plan design.
Frequently asked questions
How much should I have saved for retirement by age 30?
Fidelity uses 1× annual income by age 30 as one planning milestone under its stated assumptions. It is a guideline, not a universal minimum.
How much should I have saved by age 40?
Fidelity uses 3× annual income by age 40 as a planning checkpoint under assumptions that include a 15% combined savings rate and retirement at age 67.
How much should I have saved by age 50?
Fidelity uses 6× annual income by age 50 as a planning milestone. Your actual target can differ substantially with retirement age, pension income, Social Security, spending, and other assumptions.
How much should I have saved by age 60?
Fidelity uses 8× annual income by age 60 as a guideline under its standard assumptions.
What is the retirement savings goal by age 67?
Fidelity suggests 10× annual income by age 67 under its baseline retirement-planning assumptions. This is not a guaranteed safe balance.
What is the 2026 401(k) contribution limit?
The employee elective-deferral limit for most 401(k), 403(b), governmental 457 plans, and the federal TSP is $24,500 for 2026.
What is the 2026 IRA contribution limit?
The combined annual contribution limit for traditional and Roth IRAs is $7,500 for 2026, subject to compensation and eligibility rules.
What is the 401(k) catch-up limit for 2026?
The general catch-up limit for eligible participants age 50 or older is $8,000 in 2026. A higher $11,250 catch-up applies to eligible participants ages 60 through 63 in most covered plans.
How much should I save for retirement each year?
Fidelity suggests a combined retirement savings rate of about 15% of pretax income, including employer contributions, under its planning assumptions. Your required rate can be higher or lower.
Does an employer match count toward my retirement savings rate?
Yes. A combined savings rate can include employer contributions. Your personal employee contribution is still subject to plan rules and applicable IRS limits.
Is the average 401(k) balance a good retirement target?
No. An average account balance describes a population and may exclude other accounts, pensions, real estate, and savings. A personal retirement plan should be built from future spending and income needs.
How does starting earlier change retirement savings?
Starting earlier gives each contribution more time to compound. The effect can be large even when the monthly contribution stays unchanged, although future investment returns are uncertain.
Should I include Social Security in a retirement savings goal?
Yes, estimated Social Security can be part of a retirement-income plan because it may cover part of future spending. Use a personalized benefit estimate rather than a generic average.
Should retirement savings include my house?
A home counts in net worth, but many retirement savings benchmarks focus on financial assets intended to generate or fund retirement spending. Do not assume all home equity will be available for retirement expenses.
Can I use a constant investment return to predict retirement savings?
Use a constant return only for an educational scenario. Actual market returns vary from year to year, and fees, taxes, inflation, and contribution timing can change the ending value.
Sources
Internal Revenue Service — 2026 Retirement Plan and IRA Contribution Limits
https://www.irs.gov/newsroom/401k-limit-increases-to-24500-for-2026-ira-limit-increases-to-7500
Lists 2026 elective-deferral, IRA, SIMPLE, and catch-up contribution limits and income phase-out ranges.
Internal Revenue Service — 401(k) and Profit-Sharing Plan Contribution Limits
https://www.irs.gov/retirement-plans/plan-participant-employee/retirement-topics-401k-and-profit-sharing-plan-contribution-limits
Explains the separate employee elective-deferral limit and overall defined-contribution annual-additions limit for 2026.
Fidelity Investments — Retirement Savings Guidelines
https://www.fidelity.com/viewpoints/retirement/retirement-guidelines
Provides age-based salary-multiple milestones and a suggested 15% combined retirement savings rate under stated planning assumptions.
Fidelity Investments — Average Retirement Savings by Age — June 23, 2026
https://www.fidelity.com/learning-center/personal-finance/average-retirement-savings
Reports 401(k) balances by age and Q1 2026 contribution behavior based on Fidelity workplace and IRA datasets.
Investor.gov — Savings Goal Calculator
https://www.investor.gov/financial-tools-calculators/calculators/savings-goal-calculator
Illustrates how initial savings, time, assumed return, compounding, and recurring contributions interact in savings-goal calculations.