Finance & Money
Salary Comparison Chart
A salary comparison is most useful when every offer is converted to the same time basis. A $75,000 annual salary equals $6,250 per month, about $1,442.31 per week, or about $36.06 per hour when you assume 40 paid hours per week for 52 weeks.
The latest BLS quarterly earnings release reported $1,251 median usual weekly earnings for full-time U.S. wage and salary workers in the second quarter of 2026. That is a simple annualized $65,052 when multiplied by 52, but BLS publishes the figure as a weekly median rather than a universal annual salary benchmark. BLS provides the Q2 2026 earnings tables.
Base salary also misses benefits. In March 2026, BLS estimated private-industry employer costs at $32.60 per hour for wages and salaries plus $14.01 for benefits, making benefits 30.1% of total employer compensation. The Employer Costs for Employee Compensation release shows why two equal salaries can still represent different compensation packages.
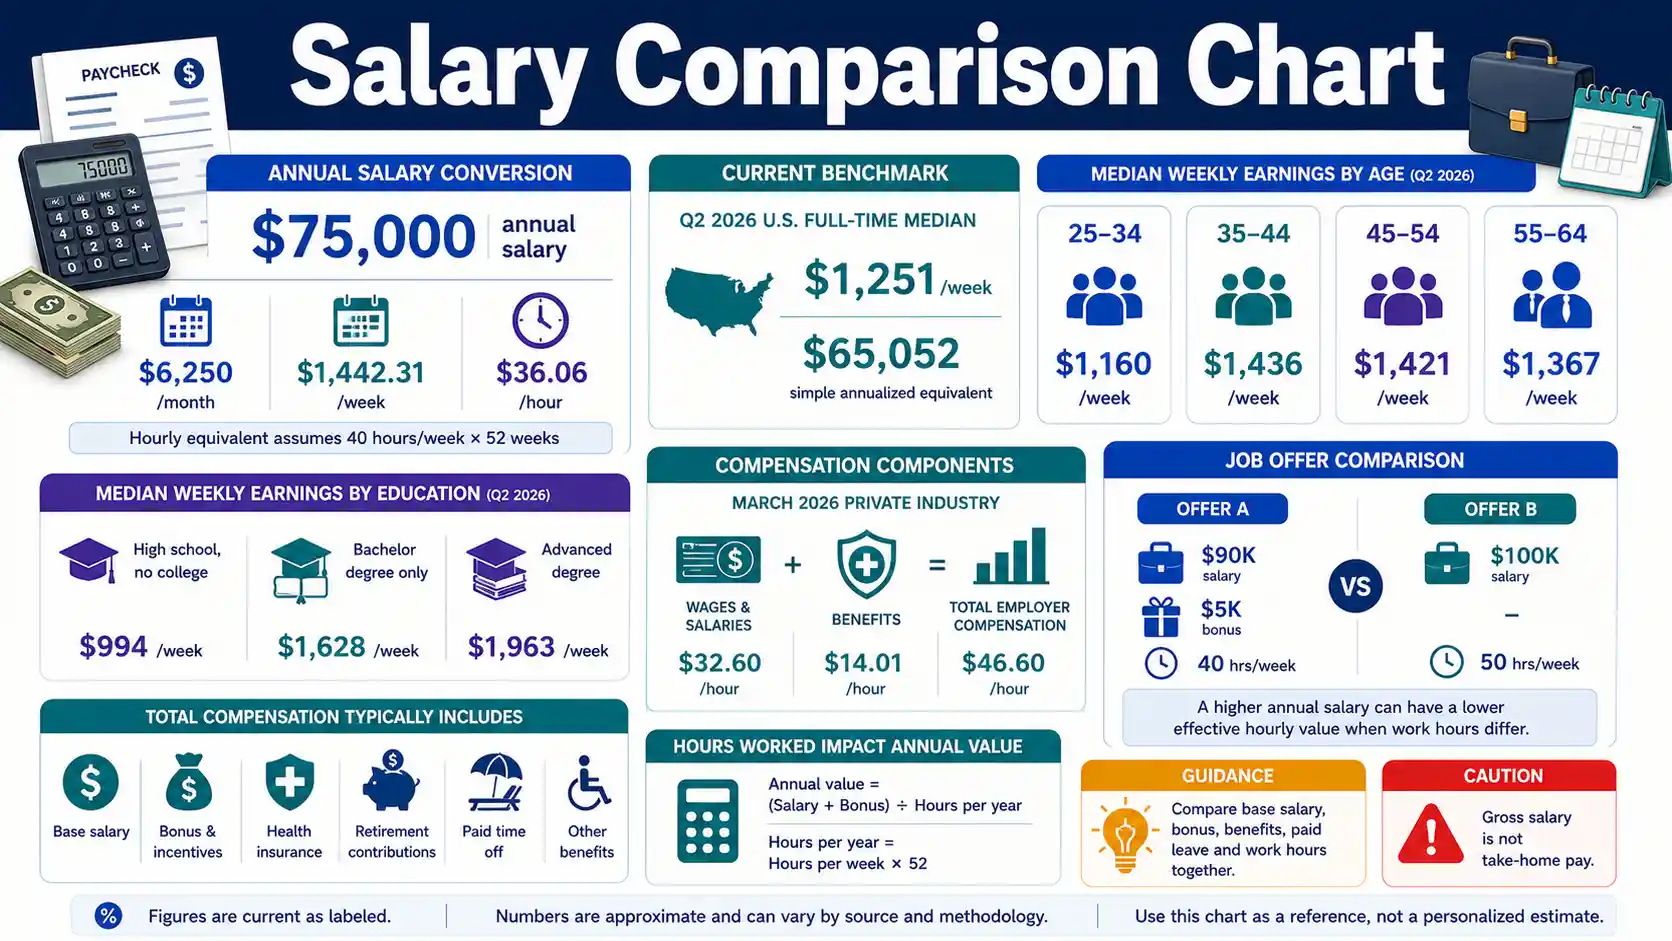
Q2 2026 U.S. median
$1,251/week
Median usual weekly earnings for full-time wage and salary workers, not seasonally adjusted.
$75,000 salary
$36.06/hour
Simple gross hourly equivalent using 2,080 paid hours per year.
Bachelor degree only
$1,628/week
Q2 2026 median for full-time workers age 25 and over with a bachelor degree only.
Private benefits share
30.1%
Benefits as a share of private-industry employer compensation costs in March 2026.
Compare salary on the same basis before judging an offer
Gross salary is before tax and payroll deductions. Take-home pay is lower for most workers because taxes, insurance premiums, retirement contributions, and other deductions come out of gross pay.
Annual salary divided by 2,080 gives a useful hourly equivalent only when 40 hours per week for 52 paid weeks reflects the real schedule. A 50-hour salaried schedule reduces effective hourly value by 20% compared with a 40-hour schedule at the same salary.
A bonus is not base salary. Compare guaranteed cash separately from commissions, discretionary bonuses, signing bonuses, equity, and other compensation whose payout may vary.
Benefits can materially change employer compensation. BLS estimates show benefits represented roughly 30% of private-industry employer compensation costs in March 2026, although employer cost is not the same as the personal value of a benefit.
Education and occupation medians describe groups rather than individuals. A worker can earn far above or below the median because of specialty, experience, industry, location, performance, schedule, and employer.
A higher nominal salary can still leave less disposable income when it comes with more hours, expensive benefits, a costly commute, relocation, or a substantially higher local cost structure.
Annual Salary to Hourly, Weekly and Monthly Pay
Gross salary equivalents assume 2,080 paid hours per year: 40 hours per week for 52 weeks. Actual hourly value changes when work hours, unpaid time, overtime, or paid leave differ.
Swipe horizontally inside the table to view every column.
| Annual salary | Monthly gross | Weekly gross | Hourly equivalent |
|---|---|---|---|
| $30,000 | $2,500.00 | $576.92 | $14.42 |
| $40,000 | $3,333.33 | $769.23 | $19.23 |
| $50,000 | $4,166.67 | $961.54 | $24.04 |
| $60,000 | $5,000.00 | $1,153.85 | $28.85 |
| $75,000 | $6,250.00 | $1,442.31 | $36.06 — $75,000 salary hourly equivalent at 2,080 hours |
| $100,000 | $8,333.33 | $1,923.08 | $48.08 |
| $125,000 | $10,416.67 | $2,403.85 | $60.10 |
| $150,000 | $12,500.00 | $2,884.62 | $72.12 |
Gross U.S. dollars before taxes and deductions.
- • Monthly salary uses annual salary ÷ 12; weekly salary uses annual salary ÷ 52; hourly equivalent uses annual salary ÷ 2,080.
- • A salaried worker regularly working more than 40 hours per week has a lower effective hourly equivalent than this table shows.
Download or export
Q2 2026 Median Weekly Earnings by Age
BLS medians for full-time wage and salary workers, not seasonally adjusted. Annualized figures simply multiply the weekly median by 52 and are not separate BLS annual estimates.
Swipe horizontally inside the table to view every column.
| Age | Median weekly earnings | Annualized equivalent | Context |
|---|---|---|---|
| 16–24 | $806 | $41,912 | Lowest broad age group shown |
| 25–34 | $1,160 | $60,320 | Early-career full-time median |
| 35–44 | $1,436 — Highest broad age-group median shown | $74,672 | Highest median among broad age groups shown |
| 45–54 | $1,421 | $73,892 | Similar to ages 35–44 |
| 55–64 | $1,367 | $71,084 | Later-career median |
| 65+ | $1,233 | $64,116 | Full-time workers age 65 and older |
| All full-time workers 16+ | $1,251 — Overall Q2 2026 median | $65,052 | 120.9 million full-time wage and salary workers |
Gross usual weekly earnings before taxes and other deductions.
- • BLS usual weekly earnings include overtime pay, commissions, and tips usually received at the main job.
- • Age medians describe groups; they are not salary targets for individuals.
Download or export
Q2 2026 Median Earnings by Education
Full-time wage and salary workers age 25 and over. Education level is associated with earnings, but field, occupation, experience, location, hours, and labor-market conditions also matter.
Swipe horizontally inside the table to view every column.
| Education | Median weekly earnings | Annualized equivalent | Median vs all age-25+ workers |
|---|---|---|---|
| Less than high school diploma | $803 | $41,756 | -39.6% |
| High school graduate, no college | $994 | $51,688 | -25.3% |
| Some college or associate degree | $1,125 | $58,500 | -15.4% |
| Bachelor degree only | $1,628 | $84,656 | +22.4% |
| Bachelor degree and higher | $1,768 | $91,936 | +32.9% |
| Advanced degree | $1,963 — Advanced degree median weekly earnings | $102,076 | +47.6% |
| All workers age 25+ | $1,330 | $69,160 | Baseline |
BLS Q2 2026 usual weekly earnings; annualized equivalents multiply by 52.
- • These data do not measure return on tuition, student debt, unemployment risk, or lifetime earnings.
- • The median is the midpoint of the earnings distribution, not an average salary.
Download or export
Q2 2026 Median Earnings by Occupational Group
BLS median weekly earnings for full-time wage and salary workers. Broad occupational groups contain jobs with very different pay levels.
Swipe horizontally inside the table to view every column.
| Occupational group | Median weekly earnings | Annualized equivalent | Q2 2025 median |
|---|---|---|---|
| Management, professional and related | $1,697 | $88,244 | $1,643 |
| Management, business and financial operations | $1,797 — Highest median among groups shown | $93,444 | $1,757 |
| Professional and related | $1,591 | $82,732 | $1,568 |
| Service occupations | $799 | $41,548 | $768 |
| Sales and office | $1,021 | $53,092 | $1,006 |
| Natural resources, construction and maintenance | $1,101 | $57,252 | $1,065 |
| Production, transportation and material moving | $968 | $50,336 | $925 |
Gross usual weekly earnings; annualized equivalents multiply weekly medians by 52.
- • Occupation medians should be compared with a specific job title, geography, experience level, and industry before evaluating an offer.
- • Some occupations include commissions, overtime, tips, or premium pay in usual weekly earnings.
Download or export
Salary vs. Total Employer Compensation
BLS Employer Costs for Employee Compensation shows why wage or salary comparisons alone can miss a substantial share of employer-paid compensation.
Swipe horizontally inside the table to view every column.
| Worker group | Wages + salaries per hour | Benefits per hour | Total compensation per hour |
|---|---|---|---|
| Civilian workers | $33.72 | $15.60 | $49.32 |
| Private industry | $32.60 | $14.01 — Private-industry average benefit cost per hour | $46.60 |
| State + local government | $40.82 | $25.59 | $66.41 |
Average employer cost per employee hour worked, March 2026.
- • Private-industry wages and salaries represented 69.9% of total employer compensation; benefits represented 30.1%.
- • Employer benefit cost is not the same as cash an employee can spend or the market value the employee personally assigns to a benefit.
Download or export
Private-Industry Wages by U.S. Census Division
Average employer wage-and-salary cost per hour worked in private industry, March 2026. Geographic pay differences can reflect occupation mix, industry mix, labor demand, cost structures, and other factors.
Swipe horizontally inside the table to view every column.
| Census division | Wages + salaries per hour | Difference vs private-industry average | Annualized at 2,080 hours |
|---|---|---|---|
| Pacific | $37.78 — Highest regional wage cost shown | +15.9% | $78,582 |
| New England | $37.76 | +15.8% | $78,541 |
| Middle Atlantic | $37.30 | +14.4% | $77,584 |
| Mountain | $31.78 | -2.5% | $66,102 |
| West North Central | $31.02 | -4.8% | $64,522 |
| South Atlantic | $30.92 | -5.2% | $64,314 |
| East North Central | $30.02 | -7.9% | $62,442 |
| West South Central | $28.97 | -11.1% | $60,258 |
| East South Central | $27.20 | -16.6% | $56,576 |
| Private industry average | $32.60 | Baseline | $67,808 |
BLS average employer wage-and-salary cost per employee hour worked. Annualized equivalents are illustrative 2,080-hour conversions.
- • These are Census-division averages, not cost-of-living-adjusted salaries and not wage medians.
- • A specific occupation can pay above or below its regional average.
Download or export
Browser-only offer comparison
Salary and Total Compensation Comparison
Compare two offers using base salary, expected variable cash pay, estimated employer-paid benefits, and realistic work hours. Keep uncertain bonus and benefit values separate from guaranteed salary.
Offer A
Offer B
| Metric | Offer A | Offer B | A − B |
|---|---|---|---|
| Base salary | $90,000 | $100,000 | -$10,000 |
| Expected annual cash compensation | $95,000 | $100,000 | -$5,000 |
| Modeled total compensation | $113,000 | $110,000 | $3,000 |
| Base salary hourly equivalent | $43.27 | $38.46 | $4.81 |
| Cash compensation hourly equivalent | $45.67 | $38.46 | $7.21 |
| Modeled total compensation / hour | $54.33 | $42.31 | $12.02 |
Hourly equivalent: annual amount ÷ entered weekly hours ÷ entered paid weeks.
Not take-home pay: the model does not calculate taxes, employee insurance premiums, retirement deductions, equity valuation, commute costs, paid-time-off value, or bonus probability.
The calculation runs only in your browser. No salary, offer, benefit, or work-schedule entry is transmitted or stored.
What to Compare Beyond Base Salary
Two offers with the same base salary can produce different cash income, employer compensation, work-hour value, and financial risk.
Swipe horizontally inside the table to view every column.
| Offer component | What to compare | Why it matters | Common mistake |
|---|---|---|---|
| Base salary | Guaranteed gross annual cash salary | Sets the core recurring cash amount | Comparing monthly take-home from one offer with gross salary from another |
| Bonus / commission | Target, formula, eligibility and historical payout | Can materially change cash compensation | Treating variable pay as guaranteed salary |
| Employer retirement contribution | Match formula, vesting and annual employer dollars | Adds compensation outside base salary | Ignoring vesting or contribution requirements |
| Health insurance | Employer contribution, premiums, deductible and out-of-pocket limit | Employer cost and employee value can differ widely | Using employer premium cost as exact personal value |
| Paid leave | Vacation, holidays, sick leave and whether leave is actually paid | Changes paid time relative to hours worked | Using 2,080 hours when substantial unpaid time exists |
| Work schedule | Typical weekly hours, overtime, on-call and travel | Changes effective hourly compensation — Work hours change effective hourly value | Assuming every salaried job equals 40 hours per week |
| Location / remote requirements | Commute, relocation, housing and tax context | Can change personal costs substantially | Calling a higher nominal salary automatically better |
| Equity / long-term incentives | Vesting, liquidity, valuation and forfeiture rules | Can add upside but also uncertainty | Treating unvested or illiquid equity as cash |
- • Take-home pay depends on taxes, payroll deductions, benefits elections, location, filing status, and other personal factors.
- • Use written offer terms and plan documents when comparing compensation.
Download or export
Common salary comparison mistakes and limitations
Do not compare gross salary with take-home pay
Gross salary is before payroll taxes and deductions. Compare gross with gross, then model taxes and deductions separately using your actual filing and benefit assumptions.
Do not treat every salaried job as 2,080 hours
Use realistic weekly hours, paid weeks, overtime, travel, on-call duty, and unpaid time when comparing effective hourly compensation.
Do not convert group medians into personal offers
BLS medians are statistical benchmarks. A specific salary should be compared with the relevant occupation, location, industry, experience, credentials, and employer.
Total compensation is not all spendable cash
Employer insurance, retirement contributions, paid leave, payroll taxes, and other benefit costs can be valuable without increasing current take-home pay dollar-for-dollar.
Equity compensation, stock options, carried interest, pensions, public-sector retirement benefits, deferred compensation, union agreements, overtime rules, tip income, commissions, expatriate packages, relocation benefits, self-employment income, and contract work require additional analysis beyond a salary conversion table.
Frequently asked questions
How much is $50,000 a year per hour?
$50,000 divided by 2,080 hours equals about $24.04 per hour before taxes, assuming 40 paid hours per week for 52 weeks.
How much is $75,000 a year per month?
$75,000 divided by 12 equals $6,250 gross per month before taxes, insurance premiums, retirement contributions, and other deductions.
How much is $100,000 a year per week?
$100,000 divided by 52 equals about $1,923.08 gross per week.
What was the U.S. median weekly pay in Q2 2026?
BLS reported median usual weekly earnings of $1,251 for full-time wage and salary workers in the second quarter of 2026.
What does $1,251 per week equal annually?
Multiplying $1,251 by 52 gives $65,052. This is an annualized equivalent, not a separately measured BLS annual salary.
Which broad age group had the highest median weekly earnings in Q2 2026?
Among the broad age groups shown by BLS, ages 35 to 44 had the highest overall median at $1,436 per week.
How much did workers with a bachelor degree earn?
Full-time workers age 25 and over with a bachelor degree only had median weekly earnings of $1,628 in Q2 2026, equal to a simple annualized $84,656.
Is salary the same as total compensation?
No. Total compensation can include employer-paid insurance, retirement contributions, paid leave, bonuses, and legally required benefits in addition to wages or salary.
How large are benefits compared with wages?
In March 2026, BLS estimated private-industry wages and salaries at $32.60 per employee hour worked and benefits at $14.01, or 30.1% of total employer compensation.
Should I compare salaries using hourly pay?
Hourly equivalents are useful when offers require different work schedules. Divide annual cash compensation by realistic annual work hours rather than automatically assuming 2,080 hours.
Does a higher salary always mean a better offer?
No. Bonuses, employer retirement contributions, health costs, paid leave, hours, commute, location, equity, job security, and career growth can change the overall value.
Should bonus income be included in salary?
Keep guaranteed base salary separate from variable bonus or commission. Compare expected cash compensation only after understanding the payout formula and likelihood.
Is employer health insurance worth its full employer cost to me?
Not necessarily. Employer cost is a compensation measure, while personal value depends on coverage, premiums, deductible, network, health needs, and available alternatives.
Can I estimate take-home pay from gross salary alone?
Not accurately. Take-home pay depends on federal, state and local taxes, filing status, payroll taxes, retirement contributions, insurance elections, and other deductions.
Why do salaries differ by location?
Location can affect labor demand, industry and occupation mix, employer costs, competition for workers, and living costs. Regional wage averages do not directly measure cost-of-living-adjusted purchasing power.
Sources
U.S. Bureau of Labor Statistics — Usual Weekly Earnings of Wage and Salary Workers — Second Quarter 2026
https://www.bls.gov/news.release/wkyeng.htm
Reports median weekly earnings for full-time wage and salary workers by sex, age, occupation, education, race, and ethnicity for the second quarter of 2026.
U.S. Bureau of Labor Statistics — Employer Costs for Employee Compensation — March 2026
https://www.bls.gov/news.release/ecec.htm
Reports average employer costs for wages, salaries, and benefits for civilian, private industry, and state and local government workers in March 2026.
U.S. Bureau of Labor Statistics — Private Industry Compensation Costs by Census Division — March 2026
https://www.bls.gov/charts/employer-costs-for-employee-compensation/costs-by-division.htm
Provides private-industry employer costs per hour for wages, supplemental pay, paid leave, insurance, retirement, and legally required benefits across U.S. Census divisions.
U.S. Bureau of Labor Statistics — Compensation Percentiles — March 2026
https://www.bls.gov/ecec/factsheets/compensation-percentile-estimates.htm
Shows wage-and-salary and benefit costs at selected wage percentiles and explains why salary alone does not capture total employer compensation.