Finance & Money
Savings Growth Chart
Savings growth depends on the starting balance, recurring deposits, time, realized yield, fees, withdrawals, taxes and inflation. A $10,000 balance earning a constant 4% APY would grow to about $14,802.44 after 10 years before taxes or fees.
APY is the right deposit-account comparison metric because it reflects the effective annual yield after compounding. The CFPB's Regulation DD definition states that APY reflects the total amount of interest paid based on the rate and compounding frequency over a 365-day period. CFPB defines APY and the stated interest rate separately.
Recurring deposits can matter more than small rate differences. Starting from zero, $500 deposited at the end of every month under a constant 4% APY reaches about $73,347.96 after 10 years. Investor.gov likewise models growth using a starting amount, contributions, time, rate and compounding.
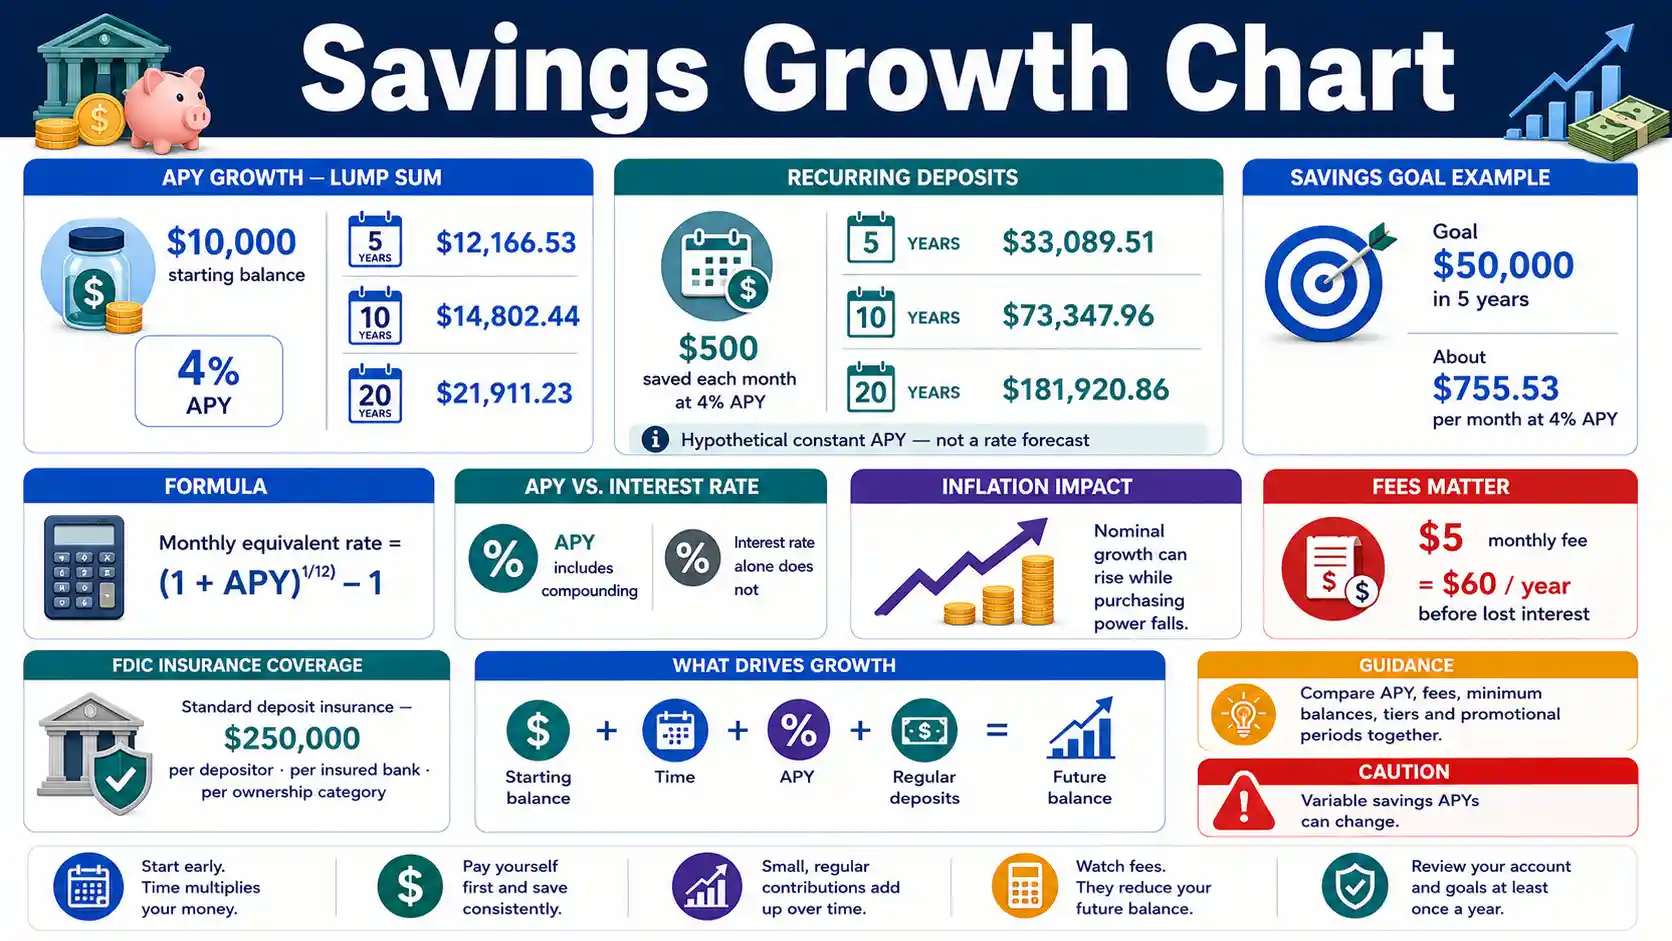
$10,000 at 4% APY
$14,802.44
Hypothetical balance after 10 years with no additional deposits, fees or withdrawals.
$500 monthly at 4%
$73,347.96
Hypothetical 10-year value with end-of-month deposits and no starting balance.
$50,000 in 5 years
$755.53/month
Approximate deposit needed from $0 at a constant 4% APY.
FDIC standard amount
$250,000
Per depositor, per insured bank, for each account ownership category.
What actually makes a savings balance grow
A higher realized APY grows the same balance faster, but a variable savings APY can fall after the account is opened. Long-term projections should test more than one rate.
Depositing consistently increases the principal available to earn interest. For most short- and medium-term goals, the monthly savings amount often has a larger effect than a small difference in APY.
Fees reduce the dollars that remain in the account. A $5 monthly fee costs $60 each year before considering the interest those removed dollars could have earned.
Inflation reduces purchasing power. A balance can rise in nominal dollars yet buy less when inflation persistently exceeds the after-tax yield.
Most bank-account interest is taxable federal income when credited and available to withdraw, subject to applicable exceptions. Taxes can therefore reduce the effective after-tax growth rate.
Eligible deposits at an FDIC-insured bank are generally insured up to $250,000 per depositor, per insured bank, for each ownership category. FDIC explains how ownership categories determine coverage.
Savings Growth by APY
Hypothetical growth of a $10,000 starting balance with no additional deposits or withdrawals. APY is treated as the effective annual yield.
Swipe horizontally inside the table to view every column.
| APY | After 1 year | After 5 years | After 10 years | After 20 years |
|---|---|---|---|---|
| 0.00% | $10,000.00 | $10,000.00 | $10,000.00 | $10,000.00 |
| 0.50% | $10,050.00 | $10,252.51 | $10,511.40 | $11,048.96 |
| 2.00% | $10,200.00 | $11,040.81 | $12,189.94 | $14,859.47 |
| 4.00% | $10,400.00 | $12,166.53 | $14,802.44 | $21,911.23 — $10,000 at 4% APY for 20 years |
| 5.00% | $10,500.00 | $12,762.82 | $16,288.95 | $26,532.98 |
Nominal U.S. dollars before taxes, fees, withdrawals, or inflation.
- • The examples assume the stated APY remains unchanged for the entire period.
- • Variable-rate savings accounts can change APY at any time under their account terms.
Download or export
Monthly Savings Growth at 4% APY
Hypothetical end-of-month deposits with no starting balance. The monthly rate is derived from a 4% effective annual APY.
Swipe horizontally inside the table to view every column.
| Monthly deposit | After 1 year | After 5 years | After 10 years | After 20 years |
|---|---|---|---|---|
| $100 | $1,221.84 | $6,617.90 | $14,669.59 | $36,384.17 |
| $250 | $3,054.61 | $16,544.76 | $36,673.98 | $90,960.43 |
| $500 | $6,109.22 | $33,089.51 | $73,347.96 — $500 monthly for 10 years at hypothetical 4% APY | $181,920.86 |
| $750 | $9,163.83 | $49,634.27 | $110,021.94 | $272,881.30 |
| $1,000 | $12,218.44 | $66,179.02 | $146,695.92 | $363,841.73 |
Nominal U.S. dollars; deposits are made at the end of each month.
- • A stable 4% APY is an illustration, not a prediction of future bank rates.
- • Earlier deposits generally earn interest for longer than later deposits.
Download or export
Monthly Deposit Needed to Reach a Savings Goal
Hypothetical monthly deposits needed when starting from $0 and earning a constant 4% APY. Deposits occur at the end of each month.
Swipe horizontally inside the table to view every column.
| Savings goal | Time available | Monthly deposit at 0% | Monthly deposit at 4% APY | Interest reduces required deposits by |
|---|---|---|---|---|
| $10,000 | 1 year | $833.33 | $818.43 | $14.90/month |
| $25,000 | 2 years | $1,041.67 | $1,002.98 | $38.69/month |
| $50,000 | 5 years | $833.33 | $755.53 — $50,000 goal over five years at hypothetical 4% APY | $77.80/month |
| $100,000 | 10 years | $833.33 | $681.68 | $151.65/month |
Hypothetical constant-rate examples; actual APYs can change.
- • The required monthly deposit falls when more time or a higher realized yield is available.
- • A goal calculator should still leave room for account fees, taxes on interest, and changing rates.
Download or export
Browser-only savings tool
Savings Growth and Goal Calculator
Model a starting balance, recurring deposit, APY, monthly fee, inflation assumption and target. APY is treated as an effective annual yield, so compounding is not added a second time.
Modeled ending balance
$88,150.41
10 years at constant 4.00% APY.
Starting + deposits
$70,000.00
Before interest and account fees.
Interest earned before tax
$18,150.41
Modeled interest generated before income tax.
Inflation-adjusted value
$68,862.96
Ending balance expressed in today-dollar purchasing power under the entered inflation assumption.
Fees charged
$0.00
Monthly deposit needed for goal
$580.78
Projected goal difference
$11,849.59 below goal
APY handling: the monthly equivalent rate is (1 + APY)1/12 − 1. This preserves the entered effective annual yield rather than compounding the APY again.
Scenario limits: APY, inflation and fees are held constant. Taxes, promotional-rate expirations, tiered balances, withdrawals and rate changes are not forecast.
The calculation runs only in your browser. No balance, goal, APY, deposit or fee entry is transmitted or stored.
APY, Interest Rate and Compounding
APY and the stated interest rate are not always identical. APY incorporates the effect of compounding over a one-year period.
Swipe horizontally inside the table to view every column.
| Concept | What it represents | Includes compounding? | Best comparison use |
|---|---|---|---|
| Interest rate | Annual stated rate applied under account terms | No, not by itself | Understand the nominal rate used to calculate interest |
| APY | Effective yearly yield based on rate and compounding frequency | Yes — APY already reflects compounding | Compare deposit-account yields on a common annual basis |
| Daily compounding | Interest calculated frequently under the account method | Reflected in APY | Understand how stated rate becomes effective annual yield |
| Monthly compounding | Interest calculated on a monthly schedule | Reflected in APY | Compare with accounts using different compounding schedules |
| Variable APY | Yield that can change after opening | Current APY reflects current terms | Check how and when the institution can change the rate |
| Fixed CD APY | Yield offered for a defined time-account term | Reflected in disclosed APY | Compare term deposits along with maturity and withdrawal penalties |
- • For a growth model that starts with APY, do not add an extra compounding boost on top of that APY.
- • Regulation DD requires deposit-account disclosures to distinguish the interest rate and annual percentage yield.
Download or export
Savings Growth After Inflation
These examples show nominal value and inflation-adjusted purchasing power for a $25,000 balance after 10 years. Rates remain constant only for illustration.
Swipe horizontally inside the table to view every column.
| Savings APY | Inflation assumption | Nominal balance after 10 years | Value in today dollars | Approx. real annual growth |
|---|---|---|---|---|
| 2% | 2% | $30,474.86 | $25,000.00 | 0.00% |
| 3% | 2% | $33,597.91 | $27,561.99 | 0.98% |
| 4% | 2% | $37,006.11 | $30,357.90 | 1.96% |
| 4% | 3% | $37,006.11 | $27,536.02 | 0.97% |
| 4% | 5% | $37,006.11 | $22,718.54 | -0.95% — Negative real growth when inflation exceeds APY |
Illustrative nominal and inflation-adjusted U.S. dollars.
- • A positive account balance can still lose purchasing power when inflation exceeds the after-tax savings yield.
- • Taxes on interest can reduce real growth further for taxable accounts.
Download or export
Savings Account Features to Compare
A high APY can be offset by fees, balance requirements, withdrawal restrictions, or a promotional period. Read the account disclosure before moving money.
Swipe horizontally inside the table to view every column.
| Feature | Why it matters | What to check | Possible effect on growth |
|---|---|---|---|
| APY | Measures effective annual yield | Current APY and whether it is variable or fixed | Higher realized APY increases interest earned |
| Monthly fee | Directly reduces account value | Waiver conditions and minimum balance | Can erase much of the interest on smaller balances — Fees can materially reduce savings growth |
| Minimum balance | May affect fee or APY eligibility | Opening and ongoing thresholds | Falling below a threshold can reduce net return |
| Tiered rate | Different balances may earn different rates | Which balance tiers receive each APY | Headline APY may not apply to the full balance |
| Promotional rate | Temporary APY may expire | End date and post-promotion APY | Long-term growth may be lower than the opening rate suggests |
| CD term | Money is committed for a defined maturity | Maturity, renewal and grace-period rules | Early withdrawal can reduce earned interest |
| Deposit insurance | Protects eligible deposits within coverage limits | Institution status and ownership category | Does not increase yield but changes account risk |
- • Compare APY together with fees and account conditions rather than using the headline yield alone.
- • FDIC insurance applies to eligible deposits, not stocks, bonds, mutual funds, or other non-deposit investments.
Download or export
FDIC Deposit Insurance Basics
The standard FDIC insurance amount is $250,000 per depositor, per insured bank, for each account ownership category. Coverage depends on account ownership and institution structure.
Swipe horizontally inside the table to view every column.
| Situation | General coverage concept | Example | Important limitation |
|---|---|---|---|
| Single account | $250,000 per owner at one insured bank — Standard single-account insurance amount | $200,000 single savings account can be fully covered | Other single accounts at the same bank are aggregated |
| Joint account | $250,000 per co-owner for qualifying joint deposits | Two qualifying co-owners may have up to $500,000 of joint-account coverage | Ownership and account requirements must be satisfied |
| Different ownership categories | Coverage can be separate by category | A single account and qualifying joint interest can receive separate coverage | Do not assume every account title creates a new category |
| Savings + checking + CDs in same category | Deposits are aggregated at the same insured bank | Product type alone does not create separate $250,000 limits | Combined category balance matters |
| Non-deposit investments | Not FDIC-insured deposit products | Stocks and mutual funds are not FDIC-insured | A bank selling an investment does not make the investment a deposit |
General FDIC coverage concepts. Use the FDIC EDIE tool for account-specific insurance questions.
- • FDIC-insured deposit products include checking accounts, savings accounts, money market deposit accounts and CDs when held at an insured bank.
- • Accrued interest is included in the insured deposit balance up to applicable limits.
Download or export
Common savings-growth mistakes and limitations
Do not compound APY twice
APY already includes the annual effect of compounding. If your model starts from APY, convert that effective annual yield to an equivalent periodic rate rather than treating APY as a nominal rate.
Do not assume a variable APY lasts forever
Savings-account yields can change. A rate shown today may not apply for a five-, ten- or twenty-year horizon.
Do not ignore fees and conditions
Monthly charges, balance tiers, promotional periods and withdrawal penalties can make the realized return lower than a headline APY suggests.
Savings growth is not investment growth
Bank deposits and market investments have different risk, insurance, liquidity and return characteristics. Do not compare a deposit APY directly with an uncertain investment return as though the risks were identical.
CD ladders, promotional accounts, tiered APYs, brokered deposits, credit-union share insurance, savings bonds, money market mutual funds, tax-exempt accounts and foreign-currency deposits can require additional rules beyond this chart. Verify account disclosures and insurance coverage before moving a large balance.
Frequently asked questions
How do I calculate savings growth with APY?
For a starting balance with no deposits, multiply the balance by (1 + APY) raised to the number of years. APY already includes the effect of compounding over a year.
How much will $10,000 grow at 4% APY?
$10,000 at a constant 4% APY grows to about $12,166.53 after 5 years, $14,802.44 after 10 years, and $21,911.23 after 20 years before taxes or fees.
How much will $500 a month grow at 4%?
With no starting balance and end-of-month deposits, $500 per month at a constant 4% APY grows to about $33,089.51 after 5 years and $73,347.96 after 10 years.
What is APY?
APY is the effective annual yield on a deposit account after accounting for the stated rate and compounding frequency over a one-year period.
Is APY the same as interest rate?
Not always. The stated interest rate does not itself reflect compounding, while APY is designed to show the effective yearly yield after compounding.
Does daily compounding always beat monthly compounding?
At the same nominal interest rate, more frequent compounding can produce a slightly higher effective yield. When two accounts disclose the same APY, that APY already normalizes the compounding effect.
How much should I save each month for $50,000 in five years?
Starting from zero and assuming a constant 4% APY, the required end-of-month deposit is about $755.53. At 0% interest, it would be about $833.33.
Can a monthly fee wipe out savings interest?
Yes. A recurring fee can outweigh interest on a small balance, especially when the APY is low. Compare annual fee cost with expected annual interest.
Does inflation matter for savings growth?
Yes. Nominal dollars can increase while purchasing power falls if inflation exceeds the account yield after taxes and fees.
Is savings-account interest taxable?
Most interest credited to a bank account and available to withdraw is taxable federal income, subject to applicable exceptions.
Are savings accounts FDIC insured?
Eligible savings deposits at an FDIC-insured bank are covered within applicable limits. The standard amount is $250,000 per depositor, per insured bank, per ownership category.
Are CDs included in FDIC insurance?
Yes, qualifying certificates of deposit at an FDIC-insured bank are deposit products covered within applicable insurance limits.
Is a money market fund the same as a money market deposit account?
No. A money market deposit account at an insured bank can be an FDIC-insured deposit. A money market mutual fund is an investment product and is not FDIC insured.
Should I use a current high APY for a 20-year projection?
Use caution. Savings-account APYs can change, so a constant 20-year rate is a scenario rather than a forecast. Long projections should test multiple rates.
How often should I update a savings goal?
Recalculate when your goal amount, deadline, starting balance, monthly deposit, APY, fees, taxes, or inflation assumptions change materially.
Sources
Consumer Financial Protection Bureau — Regulation DD — Annual Percentage Yield Definition
https://www.consumerfinance.gov/rules-policy/regulations/1030/2/
Defines APY as the percentage rate reflecting total interest paid on a deposit account based on the interest rate and compounding frequency over a 365-day period.
Investor.gov — Compound Interest Calculator
https://www.investor.gov/financial-tools-calculators/calculators/compound-interest-calculator
Shows how an initial amount, monthly contribution, time, estimated annual rate, and compounding frequency can affect long-term growth.
Investor.gov — Savings Goal Calculator
https://www.investor.gov/financial-tools-calculators/calculators/savings-goal-calculator
Illustrates the monthly contribution needed to reach a savings goal from a starting balance, time horizon, assumed rate, and compounding method.
Federal Deposit Insurance Corporation — Understanding Deposit Insurance
https://www.fdic.gov/resources/deposit-insurance/understanding-deposit-insurance
Explains the standard $250,000 FDIC insurance amount per depositor, per insured bank, for each account ownership category.
Internal Revenue Service — Topic No. 403 — Interest Received
https://www.irs.gov/taxtopics/tc403
Explains that most interest received or credited to an account and available to withdraw is taxable income, subject to applicable exceptions.